Article Text

Abstract
OBJECTIVE To assess the risk of important cardiac events while waiting for coronary artery bypass surgery (CABG) in relation to the New Zealand priority scoring system; to compare clinical characteristics of patients referred for CABG in New Zealand with those in Ontario, Canada; and to compare the New Zealand priority scoring system for CABG with the previously validated Ontario urgency score.
DESIGN Analysis of outcomes in a consecutive case series of patients referred for CABG.
SETTING University hospital.
PATIENTS All 324 patients from Christchurch Hospital wait listed for isolated CABG between 1 January 1994 and 31 December 1995.
MAIN OUTCOME MEASURES Death, myocardial infarction, and unstable angina while waiting for CABG; waiting time to surgery.
RESULTS Clinical characteristics at referral were very similar, but median waiting time was longer in New Zealand than in a large Canadian case series (212 days v 17 days). While waiting for elective CABG, 44% (114/257) of New Zealand patients had cardiac events: death 4% (13/257), non-fatal myocardial infarction 6% (16/257), readmission with unstable angina 34% (87/257). Priority scores did not predict cardiac events while waiting for CABG. Indeed, death or non-fatal myocardial infarction occurred in 4% (3/76) and 8% (6/76), respectively, of those with priority scores < 35. These people are no longer eligible for publicly funded surgery in New Zealand.
CONCLUSIONS Very long waiting times for CABG are associated with frequent cardiac events, at considerable cost to both patients and health care providers. Priority scores may facilitate comparison between countries but such scores did not predict clinical events while waiting.
- coronary artery bypass surgery
- unstable angina
- myocardial infarction
- waiting lists
Statistics from Altmetric.com
Coronary artery disease remains the most common cause of premature death and disability in New Zealand. Discharges from hospital after treatment for angina or myocardial infarction have been increasing by an average of 5% each year since 1989,1 principally because of the aging population. In contrast, the rate of publicly funded coronary bypass surgery in New Zealand decreased by 8.5% over the five years to 1995.2-4 This decrease and the 1995 rate of surgery of 33/100 000 population in New Zealand contrasts with recent increases to rates of 83/100 000 in Australia,5 and 78/100 000 in Ontario, Canada (Naylor CD, personal communication). Both these countries have a lower death rate from coronary artery disease than New Zealand.6
Randomised trials have proven that coronary artery bypass surgery (CABG) relieves angina in the large majority of patients and prolongs life in a considerable proportion.7-9 The most important predictors of survival benefit are left main or proximal left anterior descending coronary artery stenosis of ⩾ 50% diameter loss, and poor left ventricular function. For example, five year mortality is reduced by 68% in patients with left main disease and by 42% in patients with multivessel disease involving the proximal left anterior descending artery.8
New Zealand waiting lists for CABG have doubled in the five years to 1995.10 The number of patients wait listed is currently greater than the annual number of publicly funded operations. A previous study11 suggested New Zealand patients wait a long time for CABG. In a move towards rationing, the national advisory committee on core health and disability support services developed a priority scoring system12 to be applied to all patients referred for CABG from 1997 onwards. As at October 1997, government policy is to offer publicly funded CABG only to patients with a priority score of 35 points or more.
In this study, we have reviewed all patients referred for CABG according to conventional clinical criteria in 1994 and 1995, retrospectively applied two priority scoring systems, and then correlated priority scores with clinical events while waiting for CABG.
Methods
The case records and referral letters of all patients referred from our hospital for isolated CABG between 1 January 1994 and 31 December 1995 were reviewed. Patients undergoing concomitant valve surgery were excluded. Our hospital is a publicly funded university hospital and is the only hospital with coronary care and cardiac catheterisation facilities servicing a population of 400 000. Waiting time was defined as the interval between the date of the initial referral letter and the date of CABG, or 31 December 1996 if surgery had not been performed by that time. The severity of angina was classified according to the modified Canadian Cardiovascular Society classification.13 Coronary angiograms were reviewed by one operator to verify diameter stenosis present in the coronary arteries. Left main stenoses > 50% diameter were confirmed by a second operator using quantitative angiography. Ejection fraction as measured by left ventriculography or echocardiography at the time of referral, and the results of Bruce protocol exercise tests performed in these patients were collated. Information on the degree of lifestyle limitation was obtained from the patients’ clinical records. All assessments of coronary angiograms, exercise tests, and lifestyle limitation were performed blinded to clinical outcomes.
Clinical characteristics at the time of referral were used to derive the New Zealand priority score (fig 1). The scoring system used in this report is an update of that reported by Hadorn and colleagues12 and incorporates 10 points for left ventricular impairment. This score may range from 0 to 100, with points allocated for angina status (maximum 23 points), exercise stress testing (maximum 20 points), the results of coronary angiography (maximum 32 points), and left ventricular impairment (maximum 10 points). Finally, points are awarded according to the degree of impairment of the ability of the patient either to work or to care for dependents (maximum 15 points). The higher the New Zealand score, the higher the priority (fig 1).

New Zealand priority criteria for CABG. CAD, coronary artery disease; VD, vessel disease; LAD, left anterior descending coronary artery.
The Ontario urgency score13 was also calculated for the same patients. According to the Ontario criteria13patients are graded according to their severity of symptoms (class of angina) and anatomical findings on angiography. For example, the combination of rest pain despite intravenous antianginal therapy, and documented left main coronary artery stenosis ⩾ 50% diameter loss is given an urgency score of 2.15, whereas the same angiographic findings in the presence of angina on minimal exertion but no rest pain is given a score of 4.85. Scores are adjusted downward if non-invasive tests suggest high ischaemic risk. Scores may vary between 1 and 7. The lower the Ontario score, the greater the urgency.
Follow up was completed in 100% of patients by the use of a computerised patient management system and telephone follow up where required. Acute surgery was defined as surgery performed during the referral admission and elective surgery was defined as surgery not required during the referral admission. Cardiac events during follow up were defined as: myocardial infarction—at least two of three criteria (prolonged chest pain, ECG changes, and raised cardiac enzymes); unstable angina—increasing frequency of angina on minimal exertion or at rest; death—death was considered to be due to cardiac causes if the patient died of a myocardial infarction, dysrhythmia, or congestive heart failure caused by a cardiac condition. Mode of death was verified by review of clinical records or by contact with the patient’s general practitioner.
Results are expressed as median (interquartile range) or mean (SD). Proportion of women referred for CABG, incidence of left main disease, and inpatient days while waiting for surgery were compared between groups using the χ2 test. Waiting times were normalised using a loge transformation and correlated with priority scores using the Pearson correlation coefficient. Survival between subgroups defined by the New Zealand priority score was performed using Kaplan-Meier analysis.
Results
Three hundred and twenty four patients from Christchurch Hospital were accepted for acute or elective isolated bypass surgery from 1 January 1994 to 31 December 1995. The median New Zealand priority score was 46 (36–66) with 23% (76/324) of patients having a score < 35. The median Ontario score was 5.25 (4.0–6.0). The clinical characteristics of this case series are compared with those of a large Ontario case series14 in table 1. There were no notable differences in sex, age distribution, severity of angina, or coronary disease between the two series. Seventy two per cent (232/324) of the study group had 50% diameter stenoses in the left main or proximal left anterior descending coronary artery, 84% (272/324) had class III or IV angina, and 81% (264/324) were taking at least two antianginals, including a β blocker, a nitrate, or a calcium antagonist.
Baseline characteristics of the New Zealand case series compared with a contemporary Canadian case series
Over the study period there was an increase in the number of women referred for CABG from 12% (8/66) in the first half of 1994 to 33% (34/104) in the latter half of 1995 (p = 0.02). The incidence of left main disease increased from 17% (11/66) to 30% (31/104) (p = 0.18).
ONE YEAR FOLLOW UP
One year after referral, 230 patients had undergone CABG after a median of 55 days (16–159 days). Of these, 67 patients underwent acute surgery (in 96% (64/67) of cases because of their unstable angina) (table 2), and 163 patients underwent elective surgery. Ten patients died while waiting for their surgery and the remaining 84 patients were still waiting for surgery one year after referral.
Waiting time, priority points, clinical variables, and cardiac events while waiting for bypass surgery (as at 31 December 1996, median follow up 22 months)
While waiting for CABG 17 patients were readmitted with myocardial infarction, and 83 were readmitted with unstable angina. These 100 patients were readmitted on 132 occasions for a total of 1106 inpatient days before discharge home (51 patients), transfer for acute surgery (46 patients), or death (three patients).
There was an increase in readmissions over the study period. Total inpatient days in the first year after referral increased from 122 for those referred in the first half of 1994 to 363 days for those referred in the latter half of 1995 (p = 0.265).
OUTCOMES AS AT 31 DECEMBER 1996 (MEDIAN FOLLOW UP 22 MONTHS)
As at 31 December 1996, 13 patients had died while waiting with seven of these deaths occurring more than one month after referral. Eleven of these deaths were from cardiac causes. Two hundred and fifty one patients had undergone coronary bypass surgery and 60 were still waiting for surgery. Of the 257 patients who did not receive acute CABG, 107 (42%) had significant cardiac events requiring admission to hospital (table 2). Those who were readmitted with cardiac events frequently received bypass surgery before discharge home. As a result, their median waiting time to surgery was 137 (42–381) days compared to 251 (92–461) days for those not readmitted while waiting. Median scores and clinical characteristics were not different between these two groups (table 2).
OUTCOMES IN RELATION TO PRIORITY SCORES
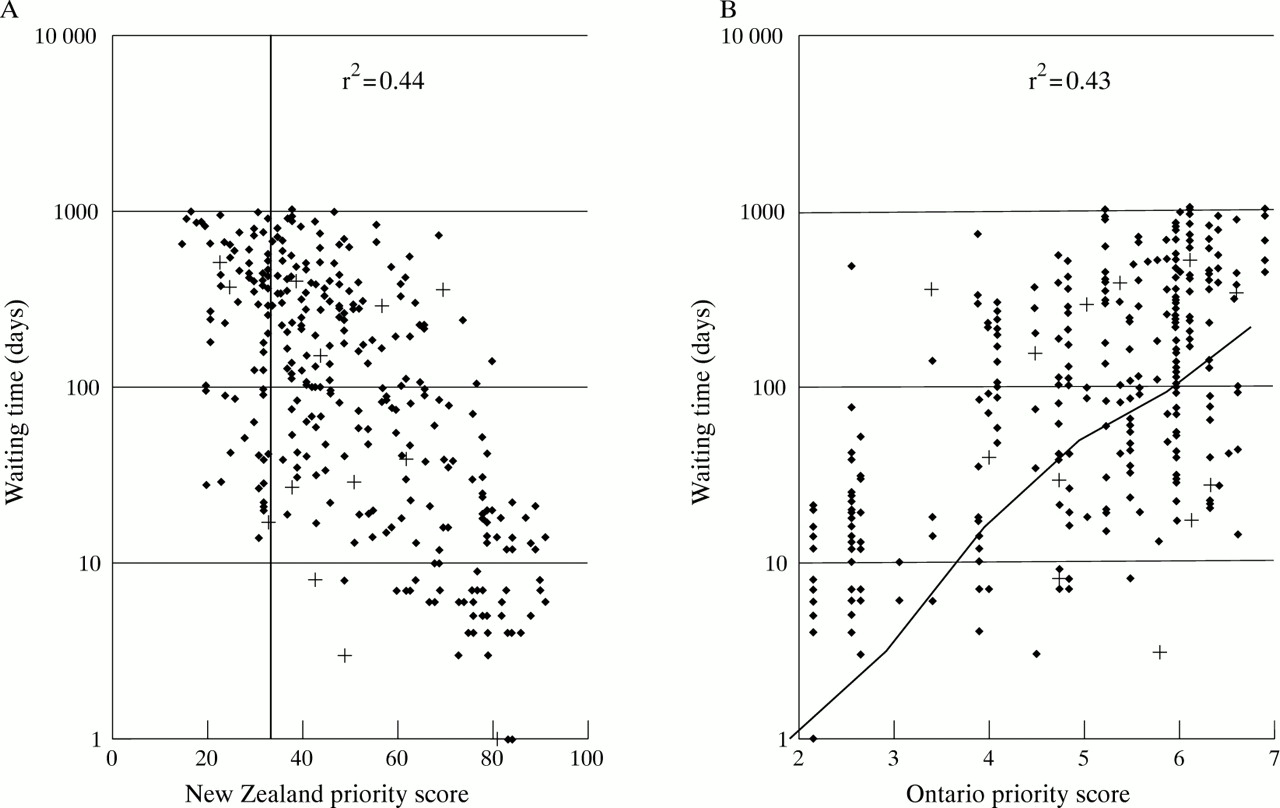
The waiting times to surgery in relation to New Zealand and Ontario priority scores are presented in fig 2 and in table 3. Waiting time was correlated with both scores (p = 0.01). As shown in fig 2B, 26% (81/311) of the patients in our series received CABG within the time limits used in Ontario.13 ,14

Waiting time (days) to coronary bypass surgery (⧫) or death (+) in relation to (A) New Zealand priority score and (B) Ontario urgency score. The vertical line on the left graph represents the present cut off for publicly funded surgery in New Zealand. The sloping line on the right graph represents the maximum acceptable waiting time as validated by Ontario authorities.13 ,19
Waiting times (days) to bypass surgery in the New Zealand case series compared with those in a previous contemporary case series
There were 22 patients with a score of < 25. Of these, one died, two had a non-fatal myocardial infarction, and five were readmitted with unstable angina. Eighteen (82%) had missing exercise test data and so may have scored higher if exercise tests had been a compulsory part of the referral process. Of the 76 patients with a New Zealand score of < 35 (the present cut off for publicly funded CABG in New Zealand), three (4%) died while waiting, six (8%) had a non-fatal heart attack, and 20 (26%) were readmitted to hospital with unstable angina. This compares with corresponding incidences of 4% (10/248), 4% (10/248), and 32% (80/248) in patients with a New Zealand score ⩾ 35 points (fig 3A, table 4). The incidence of clinical events while waiting is presented in table 4 and figs 3 and 4.

Time (days) to readmission with myocardial infarction or unstable angina while waiting for isolated coronary bypass surgery in relation to (A) New Zealand priority score and (B) Ontario urgency score. Refer to fig 2 for the description of the threshold lines on each graph.
Cardiac events while waiting for bypass surgery in relation to the New Zealand priority score (median follow up 22 months)


Kaplan-Meier analysis of time to death, myocardial infarction, or readmission with unstable angina while waiting for coronary bypass surgery, grouped according to (A) New Zealand priority score or (B) Ontario urgency score.13 Patients were censored from analysis at the time of surgery.
The time to readmission while on the waiting list did not correlate with the New Zealand priority score (r 2 = 0.009, p = 0.33, fig3A) or with the Ontario urgency score (r 2 = 0.00, p = 0.99, fig3B). Of the 107 patients readmitted because of cardiac events as at 31 December 1996, 49 patients had their first admission after the acceptable time period defined by Ontario authorities.13These 49 late readmissions occupied 455 inhospital days.
Kaplan-Meier analyses of freedom from death, myocardial infarction, or readmission with unstable angina in relation to New Zealand and Ontario scores are presented in fig 4. Each patient is censored from analysis at the time of surgery. These demonstrate considerable overlap among “high” and “low” priority patients in the first 60 days, with 20–25% of all patients suffering an event. At one year, freedom from any event is 63% in those with a New Zealand score < 35. Patients were divided into four groups on the basis of priority score: < 35 (the preset cut off for publicly funded surgery): > 65 (the “top quarter”); and arbitrary division into two further groups with scores 35–49 (33% of the group) and 50–64 (18%, see table 4). Most patients with an Ontario urgency score < 4 received early surgery, with all patients censored from analysis one year after referral.
WAITING TIME TO ELECTIVE SURGERY IN RELATION TO ANGIOGRAPHIC FINDINGS
The 53 patients with > 50% diameter stenosis of their left main coronary artery waited a median of 168 (71–280) days for elective coronary bypass surgery. The 127 patients with > 50% diameter stenosis of their proximal left anterior descending disease waited a median of 216 (60–434) days. Patients with a left ventricular ejection fraction < 50% waited 229 (76–495) days.
Discussion
We have compared referral patterns and delivery of care over time within our centre with a large Canadian series. Our data demonstrate that the baseline characteristics of our patients and Ontario patients14 are very similar (table 1), but that New Zealanders wait far longer than Canadians (table 3). The median waiting time to elective surgery in New Zealand patients was longer than the safe maximum waiting period recommended by Ontario authorities.13 Mean waiting time to surgery for all our patients was 232 days compared with 196 days and 168 days for patients referred from this institution in 1993 and 1990, respectively.11 ,15 Median waiting times in New Zealand patients were 2–14 times longer than for equivalent contemporary Ontario patients.14 These long waiting times were associated with high incidences of death (4%), non-fatal myocardial infarction (6%), and readmission with unstable angina (34%). Almost half of those readmitted subsequently received acute CABG before discharge.
The increase in the proportion of women referred for CABG during this study period is interesting, but it is not supported by data from 199311 (17% of patients referred for surgery were women) or 1996 (21% women) (unpublished data).
READMISSIONS WHILE WAITING
Thirty nine per cent of the elective patients were readmitted to hospital with unstable syndromes within the first year on the waiting list. Readmission was not predicted by New Zealand score, Ontario score, or any clinical variable at referral. Patients with a low New Zealand priority score were just as likely to be readmitted as patients with a high score. Indeed, patients who would now not qualify for surgery were just as likely to die or suffer a myocardial infarction as those with higher points (table 3).
The high rate of readmission was not caused by undermedication. Eighty one per cent of patients were on at least two of a β blocker, a calcium channel blocker, and a nitrate, while 47% were given all three classes of drugs. This compares with corresponding rates of 91% and 51% reported elsewhere.16
SCORING SYSTEMS IN CLINICAL PRACTICE
In the New Zealand scoring system, only 23% of points are awarded for symptoms. In contrast, clinical decision making is dominated by the severity and frequency of angina and other symptoms. Class IV angina was documented in 96% and 24%, respectively, of those assigned to acute or elective surgery at first referral (table 2). Similarly, 45% of those who were readmitted with unstable symptoms required acute surgery during that readmission. As a result, the median waiting time to surgery in readmitted patients was only 137 days compared with 251 days in those who were never readmitted while waiting. Patients with unstable symptoms jumped the queue in front of other patients with similar coronary disease and similar lifestyle limitations at first referral. Therefore, the correlation between New Zealand priority score and waiting time to surgery was relatively weak.
The Ontario score groups patients into six categories of urgency while the New Zealand score ranges from 1 to 100, suggesting a high level of discrimination. It is inappropriate to suggest that a patient with a score of 66 is less urgent than a patient with a score of 67—the tool is not that robust. Final priority should be a clinical decision not an administrative one, particularly in the face of extremely limited resources.
URGENCY VERSUS ACCESS TO SURGERY
The Ontario scoring system is designed to rate urgency, ensuring patients receive treatment within a time that is both appropriate to their condition and consistent throughout the province. The New Zealand priority score uses similar criteria, is strongly correlated with the Ontario score, and may be similarly valid if used in this way. However, we are concerned that the New Zealand score is being used to ration access to surgery. Need is not the same as urgency. Access to treatment should be based on the proven benefits (reduction in symptoms and improved quality and length of life) weighed against likely costs (operative mortality and morbidity) for each patient. Much of the evidence needed for this has been accumulated in previous randomised trials and by clinical audits. Access to treatment should not be based on a numerical score that has not been validated against the risks and benefits of surgery, or the risks of myocardial infarction and other cardiac events. Indeed, the New Zealand priority score did not predict cardiac events in this study.
MORTALITY IN PREVIOUS STUDIES
Four per cent (13/257) of our patients died while waiting for surgery, with 45% of them dying after waiting longer than recommended by Canadian authorities.13 This compares with death rates of 0.4% in Ontario (median wait 17 days for surgery),142.2% in the Netherlands (mean wait 63 days),17 and 2.1% in Sweden (median wait 12 and 17 months from first assessment for angina to percutaneous transluminal coronary angioplasty or CABG, respectively).18
The longer the wait, the higher the risk of death. As death or readmission was not predicted by score it would seem sensible to reduce waiting times as much as possible.
LIMITATIONS
This study has a number of limitations, principally because of its retrospective design. Patient symptoms were not systematically recorded while waiting or at readmission. Therefore, we were unable to adjust numerical priority scores while on the waiting list or explore trends in priority scores while waiting. The waiting time was calculated from the date of referral by a cardiologist for surgery; information was not collected on additional waiting times for specialist assessment or for elective angiography. Undoubtedly, the duration of symptoms was much longer for some patients. Complete calculation of priority scores was not possible, as not all patients had functional testing, especially patients with class III and class IV angina. Consistent with present policy, patients with class IV angina were given maximum points on the assumption that their test would be highly positive, while class III patients with missing exercise tests were given 0 points.
FUTURE DIRECTIONS
The current rate of CABG in New Zealand results in many patients with “surgical disease” being managed medically. While we continue to advocate for higher rates of CABG in line with international practice, we must monitor closely the progress of these patients, especially those who are denied surgery because their priority scores are too low.
CONCLUSIONS
Neither the New Zealand priority score nor the Ontario urgency score predicted the risk of further cardiac events while waiting a long time for surgery. Therefore, these scores have little validity in the setting of low intervention rates and chronic underfunding as exists in New Zealand. The high incidence of cardiac events in this study suggests that New Zealand waiting times are dangerously long and inappropriate for the severity of coronary disease in those referred.
We believe that New Zealand rates of bypass surgery are discordant with both the overall health spending and the economic health of our country. Our surgical rates reflect government policies, not clinical need or economic capacity, and compare very unfavourably with other countries in the Organisation for Economic and Commercial Development. We applaud recent initiatives to increase funding but remain concerned at the use of an urgency score to ration access to publicly funded surgery.