Article Text

Abstract
Objectives To examine the weekly working hours of Norwegian hospital doctors from 1994 to 2012 with special emphasis on the quality of postgraduate training and work–home balance, and in relation to the requirements of the European Working Time Directive (EWTD).
Design Panel study based on postal questionnaires.
Setting Norway.
Participants Unbalanced cohort of 1300–1600 doctors in 1994, 1995, 1996, 1997, 2000, 2002, 2004, 2006, 2008, 2010 and 2012.
Outcome measures Self-reported total weekly working hours and whether 45 weekly working hours are too short, sufficient, or too long to meet the quality requirements of obligatory postgraduate training for junior doctors.
Results From 1994 to 2012, the number of weekly working hours was stable for senior (46–47 h) and junior (45–46 h) hospital doctors. In 2012, significantly more senior (27–35%) than junior (11–20%) doctors reported suboptimal work–home balance, defined as working more than 48 h a week. The majority perceived the present situation with an average of 45 h per week for juniors as sufficient for obligatory postgraduate specialist training, but doctors of higher age (OR 1.04, 95% CI 1.01 to 1.08), senior doctors (1.07, 1.04 to 1.11) and doctors working in surgical specialties (OR 1 vs laboratory medicine 0.03, 0.01 to 0.25, internal medicine 0.31, 0.17 to 0.58, psychiatry 0.12, 0.04 to 0.36, paediatrics 0.36, 0.12 to 1.07, anaesthesiology 0.08, 0.02 to 0.39, gynaecology 0.07, 0.01 to 0.56 and others 0.39, 0.04 to 3.56) were more likely to want the work-week to be longer.
Conclusions The weekly working hours of Norwegian hospital doctors were always below the EWTD requirements. A significant growth of hospital doctor density over the past two decades, national regulations and cultural values might be important factors. Specialty differences in perception of sufficient training time may call for more flexibility in working time regulations.
- EDUCATION & TRAINING (see Medical Education & Training)
This is an Open Access article distributed in accordance with the Creative Commons Attribution Non Commercial (CC BY-NC 4.0) license, which permits others to distribute, remix, adapt, build upon this work non-commercially, and license their derivative works on different terms, provided the original work is properly cited and the use is non-commercial. See: http://creativecommons.org/licenses/by-nc/4.0/
Statistics from Altmetric.com
Strengths and limitations of this study
-
The study documents that working hours among Norwegian hospital doctors have always been below the European Working Time Directive requirements.
-
The representative cohort with repeated data allows for generalisation to the whole population of hospital doctors in Norway.
-
Self-reported working hours may deviate from the actual number of hours worked, but it is not easy to judge whether the respondents are likely to overestimate or underestimate their own hours.
Introduction
The question of doctors’ working hours is an important public health issue. Too long hours may reduce the quality of healthcare, threaten patient safety and influence and affect the doctors’ own health and work–home balance.1 ,2 In 2000 the European Working Time Directive (EWTD)3 signalled a gradual reduction in weekly work hours for junior doctors from a maximum of 58 h in August 2004 to 56 h in August 2007 and to 48 h in August 2009. Member states could apply for further postponement of introduction of the 48 h work-week until August 2012 at the latest, but it is still possible for member states to apply their national legislation, also, when it allows for more than 48 h work-weeks for doctors.4 A number of member states have introduced rotas to restrict the number of hours worked.5 ,6
In the non-European Union (EU) member state Norway, where doctors’ working hours has been a subject for annual deliberations between employers (state, counties, hospital trusts) and the doctors through The Norwegian Medical Association since 1985, a reduction in working hours for doctors had already taken place between 1960 and 1988. The contracted basic 48 working hours from 1960 was reduced to 37.5 h for most employees in 1987, and to 35.5–37.5 h for doctors in 1988.7 ,8 Presently, all full-time employed junior and senior doctors have a contracted basic working week of 35.5–37.5 h, with the possibility of a permanent 2.5 h extension. Doctors are not obliged to work beyond this, but they can choose to extend their weekly working time up to 60 h. The working pattern is usually day-working with on-call duties, where at least 20 h/week must be between 7:00 and 17:00 from Monday to Friday.9 ,10
On this background we think a more detailed description on how Norway and Norwegian doctors get along with their long-standing comparatively short working weeks might be of international interest.
A study based on all Norwegian hospital doctors on full-time shows that the number of planned weekly working hours plus hours from overtime increased from 43.17 h in 2001 to 45.04 h in 2003 and fell to 42.76 h in 2007.11
We have surveyed a representative cohort of Norwegian doctors regularly from 1994 to 2012, and one of the most central and repeated measures has been self-reported weekly working hours. Studies with data from 2006 show that hospital doctors in Norway enjoy a higher level of satisfaction with working time12 and a shorter working week compared with hospital doctors in Germany, with lower proportions of doctors exceeding a 9 h working day (27% vs 59%) and 60 h on-call per month (18% vs 63%), respectively.13 A preliminary analysis of weekly working hours in 2000 and 2010 among all hospital doctors working full-time and part-time suggests stability of 45 h for senior doctors and a slight increase from 42 to 43 h for junior doctors.14
Several publications from EU member states report higher weekly working hours in groups as diverse as Irish junior doctors (more than 63 h in 2013),15 general surgical trainees in the Netherlands (55 h in 2005),16 surgical residents in Switzerland (55 h in 2005),17 most consultants (>50 h in 2005), the majority of junior doctors (56 h in 2010) and many of the medical specialist registrars on night shifts (90 h in 2006) in the UK.18–20 Two cross-sectional studies show that weekly working hours declined but remained high in Austria (59 h in 2006, 54 h in 2013)21 and in Germany (57 h in 2007, 55 h in 2010, >48 h 74% of doctors in 2013).22 ,23 A study among doctors in France demonstrates a decline in working hours from 53 h in 1977 to 48 h in 2007.24
A good balance between professional and private life is of increasing importance in modern society, also for doctors. Many hospital doctors—particularly female doctors—try to reduce their working hours by choosing family friendly specialties with less on-call or shift duties.11 ,25–28
In Norway, the majority of doctors start their postgraduate training shortly after the internship period by applying to hospital trusts for training positions. Junior doctors in hospitals have the right and duty to receive teaching and vocational training leading to their specialist accreditation. According to the specialty, 100–300 course hours are also required. The content of the undergone training is usually documented through course examinations, procedures and skills requirements, attestation forms, checklists, etc, plus documented participation of at least 2 h/week in the hospital teaching programme. The training typically takes 5–7 years. According to a study of junior doctors in Norway from 1999 to 2010,25 67.9% of women and 78.7% of men completed their specialisation by the end of study. Hospital factors such as more supervision, lower workload related to routine patient treatment and working in university hospitals or central hospitals reduced the time to attain the specialist qualification.
The impact of the EWTD on educational opportunities for junior doctors has been widely debated over the last decade.29–31 Two recent publications from the UK suggest that doctors are critical of the implementations of the EWTD. In the study with data from 2010, no doctor reported that the EWTD improved training opportunities for junior doctors.32 In another study with data from 2012, the majority of doctors felt that the EWTD had benefited neither junior nor senior doctors. More negative views were reported by doctors in surgical specialities.33 How doctors in Norway perceive the relationship between the quality of postgraduate training for junior doctors and the actual work-week is unknown.
The main aim of the study is to describe the weekly working hours for junior hospital doctors in specialisation (interns and residents) and senior hospital doctors (consultants) in Norway based on panel data from 1994 to 2012, and in relation to the requirements of the EWTD. The study also looks at the work–home balance and the perceived quality of postgraduate training within the actual working week.
Methods
Design and participants
Since 1994 the Institute for Studies of the Medical Profession at the Norwegian Medical Association has regularly surveyed a representative panel of active Norwegian doctors with mailed questionnaires. The original panel was based on an invitation to 2000 active Norwegian doctors, randomly selected in 1993 from the master file of the Norwegian Medical Association, which includes almost all doctors in Norway. The 1272 doctors who agreed to participate were representative of the total doctor work force in terms of age, sex, specialty and place of work. Whenever new younger members were to be included, a group of randomly selected doctors were invited. The number of invitees was estimated according to the age composition of all active doctors, taking into account that only about 50% would agree to participate. In this way the unbalanced cohort has remained representative, with only negligible deviations. The cohort was supplemented with approximately 400 young doctors in 2000, 250 young doctors in 2008 and 300 in 2012. Over the same period 470 doctors have left the panel due to retirement, death or voluntary withdrawal. The 2012 sample comprised 1792 doctors. The response rates ranged from 67% to 95%. The present study is based mainly on responses from junior and senior hospital doctors. The numbers of junior and senior doctors in the 11 waves of the survey were different (table 1).
The numbers, response rates and composition of the 11 waves of the survey
As shown in figure 1, there is a rather considerable attrition and renewal in the groups of junior and senior doctors between each round. This is because some respondents retire, withdraw from the panel or change their profession or position (eg, general practitioner (GP), specialist in private practice, researcher or doctor in administrative function). A few senior doctors (n=4) become junior doctors when they develop their professional career on a subspecialty or a second specialty.

Sample characteristics.
Measurements
Weekly working hours
The following question was asked at all 11 points in time: “In an average working week, approximately how many hours do you spend on: Working with patients, meetings, paperwork, telephones, other tasks.” Graphically the time components were ordered vertically, and the respondents were to calculate their own total number of hours. Based on respondents’ feedback, the 2006 questionnaire was slightly revised to also single out secondary position, and from 2008 it also specified the time spent on on-call work and professional update such as reading or attending courses.
| The questionnaire layout in 2012 was: | |
|---|---|
| In an average working week, including on-call duties and any secondary position, approximately how many hours do you spend on: | Hours per week |
| Patient work (all direct patient or peer contacts, including telephones, etc) | |__|__| |
| Meetings (team meetings, supervision, etc) | |__|__| |
| Paper work, telephones, emails, etc | |__|__| |
| Professional update | |__|__| |
| Other job-related tasks | |__|__| |
| Sum: total number of hours per week | |__|__| |
Work–home balance
Work–home balance can be measured by different methods.28 ,34 We define working more than 48 h a week on a regular basis as a suboptimal work–home balance.35
Perceived quality of postgraduate training
In 2012 the following question was asked: the average work-week for junior doctors is approximately 44.9 h. How do you perceive these hours in relation to the quality of postgraduate medical training within your specialty? The response alternatives were: ‘could be shorter’, ‘about right’ and ‘could be longer’. This question was answered by junior and senior doctors.
Job situation and specialty
In all waves of the survey we asked about job situation and medical specialty. Job situation is grouped into hospital doctors (seniors and juniors), GPs, private practice specialists, researchers, doctors in administrative positions and others. In the present article we concentrate on the seniority level: senior and junior hospital doctors. Senior doctors are specialists permanently employed by the hospital trusts. Junior doctors are specialists in training with limited contracts with the hospital trusts. Specialists in general surgery or general internal medicine usually continue on a subspecialist career, which may imply going back to junior status until the subspecialty authorisation is acquired.
In 2012 there were 43 different medical specialties in Norway, including five subspecialties under general surgery (cardiothoracic surgery, gastroenterological surgery, paediatric surgery, urology and vascular surgery) and eight under general (internal) medicine (cardiology, communicable diseases, endocrinology, geriatrics, gastroenterology, haematology, renal diseases and respiratory medicine). For the purpose of this study the 43 specialties are collapsed into eight specialist categories: surgery, internal medicine (plus neurology), anaesthesiology, gynaecology, paediatrics, psychiatry, laboratory medicine (including radiology and pathology) and others.
Analysis
Proportions were compared with 95% CIs. General linear modelling with age as covariate and gender and seniority level as fixed factors (analysis of covariance) was used to estimate weekly working hours at different points in time. Separate analyses for gender were also performed. Full-time work was defined as 37 h or more per week.36 Based on cross-sectional data in 2012, two multivariate logistic regression models were used. One model assessed the association of suboptimal work–home balance (defined as more than 48 h/week) with gender, age, seniority and medical specialty. Another model estimated the simultaneous effect of gender, age, total weekly working hours, medical specialty and seniority level on the perceived quality of the postgraduate training. Units with missing data were excluded. Predictive Analytics Software Statistics 19 was used for the analyses.
Results
Sample characteristics
Table 2 shows the sample characteristics and the representativeness of the sample with regard to age, gender and seniority level in 1994 and 2012.37 The proportion of women increased significantly from 1994 to 2012 in our samples and in the general hospital doctor population. The proportion of junior doctors among our respondents compared with all hospital doctors was significantly lower in 1994, while it did not differ significantly in 2012. The proportion of senior doctors was comparable in our sample and all hospital doctors in 1994, but significantly higher in our sample in 2012. These differences are consequences of the unbalanced cohort design.
Sample characteristics and representativeness of the sample with regard to seniority, gender and age in 1994 and 2012
Average work-weeks
From 1994 to 2012, the majority of hospital doctors worked full-time, but the proportion of part-time working doctors (with 95% CI) increased slightly among seniors (from 5.2%, 2.9 to 7.5 to 6.5%, 4.2 to 8.8) and significantly among juniors (from 3.4%, 0.8 to 6.1 to 10.2%, 6.4 to 14).
Figure 2 shows the estimated average number of weekly working hours for full-time working senior and junior doctors controlled for gender and age. The work-week is stable over the 18-year period. Senior doctors reported slightly longer hours (46–47 h) than junior doctors (45–46 h), but the difference is not statistically significant as judged from the 95% CIs (except for 2000).

Average weekly working hours for senior (blue) and junior (green) hospital doctors in full-time, with 95% CI, from 1994 to 2012, and in relation to the requirements of the European Working Time Directive (red).
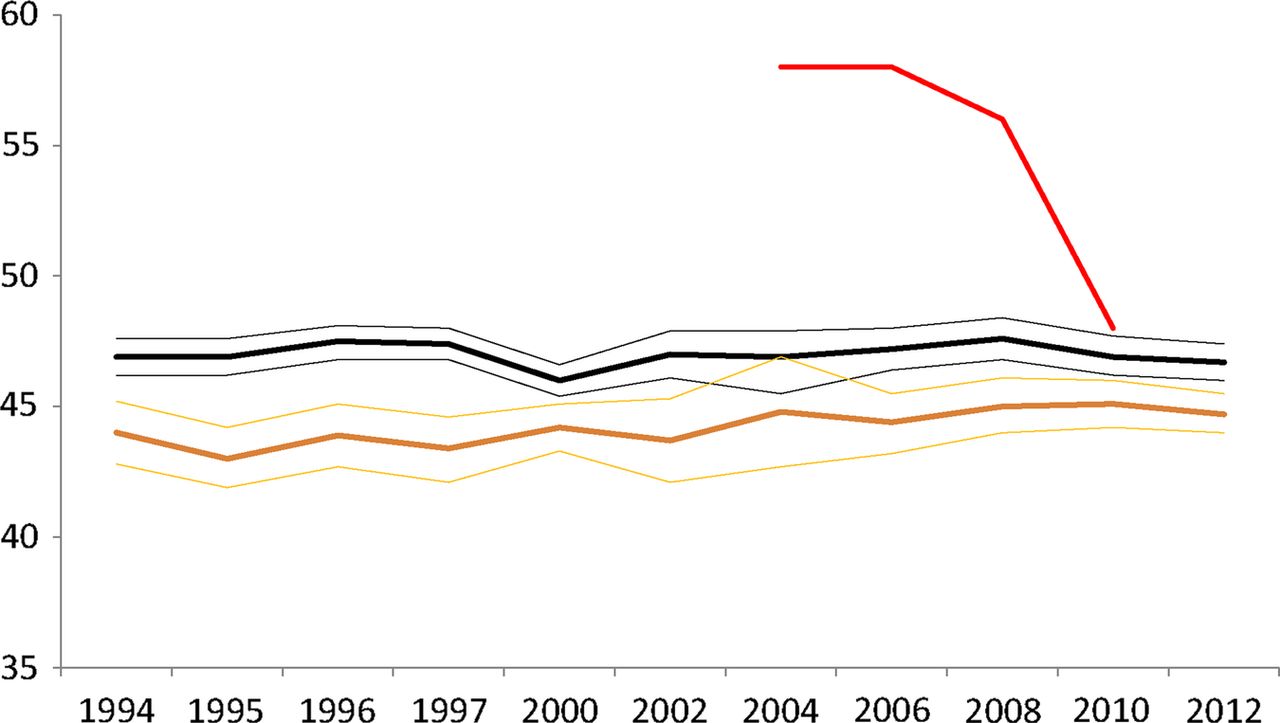
Figure 3 shows that full-time working female hospital doctors in Norway over the whole period have worked significantly fewer hours (43–45 h) than their male colleagues (47–48 h; except for 2004). However, this difference is decreasing over time.

Average weekly working hours for female (yellow) and male (black) hospital doctors in full-time, with 95% CI, from 1994 to 2012 and in relation to the requirements of the European Working Time Directive (red).
We also looked at the interspecialty differences in an average work-week (with 95% CI, controlled for gender, age and seniority) for hospital doctors in 2000 and 2012, respectively, before and after the effectuation data of the EWTD. The number of weekly working hours remained unchanged for all specialist groups: surgical domain (47.1, 46 to 48.3 vs 47.7, 46.3 to 49), laboratory medicine (44.7, 43.4 to 45.9 vs 44.7, 43.1 to 46.2), internal medicine (46.1, 45.3 to 46.9 vs 46.7, 44.9 to 46.5), psychiatry (43.4, 42.2 to 44.6 vs 44.3, 43.1 to 45.6), paediatrics (45.2, 43.6 to 46.8 vs 46.5, 44.4 to 48.6), anaesthesiology (46.1, 44.5 to 47.8 vs 45.9, 44.1 to 47.7), gynaecology (45.6, 43.7 to 47.5 vs 46.1, 44.2 to 48.1) and others (45.7, 43.5 to 47.8 vs 42.9, 39.8 to 46). Doctors in the surgical domain had longer working weeks than doctors in other specialist groups in 2000 as well as in 2012 (data not shown).
In 2012, the estimated average work-week (with 95% CI) for different categories of full-time working doctors in Norway, controlled for age and gender, was 44.7 (43.6 to 45.8) hours for junior hospital doctors, 46.4 (45.6 to 47.1) for senior hospital doctors, 47.4 (45.7 to 49.1) for full-time researchers, 44.3 (42.2 to 46.3) for doctors in administrative positions, 47.5 (46.6 to 48.3) for GPs and 45 (43.2 to 46.9) for private practice specialists. No significant changes were found from 2000 to 2012 (data not shown).
Work–home balance
From 2002 to 2012 (before and after the effectuation date of EWTD), the proportion of doctors working more than 48 h/week (with 95% CI), our criterion for a suboptimal work–home balance, decreased among junior doctors from 26% (17.5 to 34.4) to 14.6% (10.6 to 19.8) and increased among senior doctors from 23.9% (18.1 to 29.7) to 30.7% (26.5 to 35.3).
In a multivariate logistic regression model, suboptimal work–home balance in 2012 (n=670), controlled for age was significantly associated with being a senior doctor (OR 2.18, 95% CI 1.25 to 3.81), being male (1.51, 1.01 to 2.25) and working in the surgical domain (OR=1) vs laboratory medicine (0.37, 0.18 to 0.76), internal medicine (0.58, 0.34 to 0.98), psychiatry (0.37, 0.19 to 0.74), paediatrics (0.70, 0.30 to 1.65), anaesthesiology (0.48, 0.21 to 1.09), gynaecology (0.53, 0.22 to 1.28) and others (0.75, 0.17 to 3.31; data not shown).
Time for postgraduate training
The majority of hospital doctors (64.2%) reported that a 45 h work-week was sufficient for securing the quality of obligatory postgraduate training for junior doctors, while a minority reported that it could have been shorter (24.8%) or it could have been longer (11%; data not shown).
Table 3 shows a multivariate logistic regression model with wanting more than 45 h a week for postgraduate training as response variable. Significant associations were found with age, being a senior doctor and working within surgical specialty, but not with gender or total weekly working hours.
Logistic regression with wanting more than 45 h a week for postgraduate training in 2012 as response variable, N=628
Figure 4 shows the proportion of different hospital-based specialties in Norway who think a 45 h work-week is about right (blue), could have been shorter (grey) and could have been longer (red) in relation to the quality of specialist training in 2012. The variation is considerable. Doctors in most surgical specialties were more likely to report that the work-week could be longer.

Proportion of different hospital-based specialties in Norway who think a 45 h working week is about right (blue), could have been shorter (grey) and could have been longer (red) in relation to the quality of specialist training in 2012. Specialties marked * are surgical subspecialties that require three extra years of training after authorisation in general surgery. Specialties marked ** are medical subspecialties that require three extra years of training after authorisation in general (internal) medicine. Numbers of respondents are in parentheses.
Discussion
Main findings
Average weekly working hours for Norwegian hospital doctors have remained more or less unchanged between 1994 and 2012, and amount to approximately 46–47 h for senior doctors and 45–46 h for junior doctors, lower than the requirements of the EWTD, starting at 58 h in 2004 and going down to 48 h in 2009. In 2012, the majority of senior and junior doctors in Norway expressed that this was sufficient for the obligatory postgraduate training.
Comparison with other studies
A cross-national comparison of doctors’ working hours is limited by methodological differences. However, Norwegian junior and senior doctors, clearly, have shorter working hours than other hospital doctors in the EU, who reported between 50 and 90 h a week during the last decade.6 ,15 ,16 ,18 ,19 ,21–23 In contrast to Norway, the weekly working hours for hospital doctors in Austria, France, Germany and the UK all decreased after the introduction of the EWTD.21–24 ,30 Norwegian doctors also seem to have a better work–home balance. Working more than 48 h/week was reported from 30.7% of senior and 14.6% of junior doctors in 2012, compared with 73% of German hospital doctors in 2013,23 and 68% of UK consultants in 2005. In 2013, 36% of Austrian hospital doctors worked more than 60 h/week,21 compared with only 2.5% in our sample in 2012 (data not shown).
Weekly working hours for Norwegian junior doctors is slightly shorter than for senior doctors. In other European studies there is no clear pattern.21 ,23 ,24 The longer working hours for male doctors is more consistent.6 ,13 ,24 ,38 ,39 Longer work-week among seniors and male doctors is a possible explanation for the significant association of suboptimal work–home balance (defined as working more than 48 h a week) with being a man and being a senior doctor.
In comparison with most other professional groups in Norway, senior and junior doctors are more likely to work longer hours, even though such a comparison must be made with caution. In the OECD study from 2011 on Better Life Index, 2.8% of employed Norwegians had a working week longer than 50 h40 compared with 28.7% of senior and 12.2% of junior doctors in our sample in 2012 (data not shown). In a national survey from 2011,36 2% of office workers, 3% of cleaners, 4% of sales and service occupations, 6% of college graduates, 7% of craftsmen, 13% of managers, 13% of university graduates, 13% of chauffeurs, 20% of transport workers, and 42% of farmers and fishermen worked more than 45 h/week, compared with 55% of senior and 35% of junior doctors in our 2012 sample (data not shown).
Interestingly, the total weekly working hours in Norway for full-time employed junior and senior doctors that are subject to national legislations9 ,10 are similar to those of GPs and private practice specialists who decide their own working hours. No comparative studies were found on this issue.
In 2012, the majority of senior and junior doctors in Norway felt that the present 45 h working week is sufficient for postgraduate training. This is in accordance with a review by Temple of the impact of the EWTD on the quality of training for doctors showing that a high quality of training can be delivered within the framework of a 48 h working week.30 The fact that doctors in most surgical domains in our study were more likely to report that the work-week could have been longer in relation to the quality of obligatory specialist training for juniors is in line with a number of studies discussing the effect of working time reduction on the performance of surgeons.29 ,32 Our findings that senior doctors were more inclined than junior doctors to have more than 45 h/week for postgraduate training, confirm previous studies.29
Why is Norway different?
Hospital doctors’ work conditions are, of course, closely associated with work organisation41 and national directives.5
One of the main differences between the European and the Norwegian directives on doctors’ working time is the effectuation date. In Norway, a significant reduction of working hours for doctors took place already between 1960 and 1988.8 ,36 Today, the contracted basic working week in full-time employment in Norway (35.5–40 h) is lower than the maximum weekly working week in the EWTD (48 h). However, the European and the Norwegian directives include an opt-out option allowing for longer hours with the employee’s consent. It is also worth noting that working hours for junior and senior hospital doctors in Norway since 1985 have been decided through annual deliberations between the relevant employer and employee organisations.7
Hospital doctor density and workload influence working hours. OECD data from 2012 show a density of practising doctors per 1000 inhabitants in Norway of 3.7, higher than in most other European countries, for example, the UK (2.8), Belgium (2.9), Finland (3.2) and Denmark (3.5).42 Norwegian doctor workforce statistics indicate a significant increase in practising junior doctors, from 2558 in 1994 to 5063 in 2012, and senior doctors from 3700 in 1994 to 6892 in 2012 (table 2).37 According to Statistics Norway, the number of doctors from 1990 to 2009 increased faster than in any other European country, particularly hospital doctors.43 Furthermore, a study of staff and productivity in somatic specialist healthcare in 2008 suggested a lower workload for hospital doctors due to more hospital doctors and less clinical productivity (measured by numbers of hospital dismissals and outpatient consultations and treatments) in Norway than in Denmark, Finland, Germany and Scotland.44
The family friendly Norwegian welfare system should also be mentioned. The Norwegian legislations grant mothers a year's leave with full pay in connection with childbirth or adoption, and the fathers are entitled to an additional 3 months. This in itself is a strong driver for shorter work-weeks.
Adherence to mandatory regulations of hospital doctors’ work time varies considerably within European countries. A study on UK junior doctors’ working arrangements from 2008 to 2010 shows that over half of the junior doctors experienced pressure to work unofficially beyond the work time limit.20 A survey by the Royal College of Physicians in 2004 found that many junior doctors were forced to work over 90 h during seven-night rotas.19 According to surveys by the German Doctors Union and the Norwegian Medical Association, 59% of German hospital doctors complained about the renege on stipulated maximum working hours, while only 30% of the Norwegian hospital doctors reported pressure from the hospital administrations to deviate from actual work time agreements.22 ,45 Only very few senior (2–4%) and junior (1–3%) doctors in Norway ever exceed the 60 h/week maximum (data not shown).
We have shown that the difference in weekly working hours between senior and junior doctors in Norway was not statistically significant, with the exception of 2000. This may partly be due to small differences in remuneration between senior and junior doctors. In a study from 2007, immigrant German doctors in Norwegian hospitals reported better collegial teamwork and no or flat hierarchy between seniors and doctors in training as reasons for coming to and staying in Norway.46 In a study with data from 2006 we have shown how Norwegian doctors when compared with their colleagues in German hospitals were significantly more satisfied with working hours and payment.12
Adherence to working time regulations and a good balance between professional and private life are important cultural values in Norway. In the Fourth European Working Conditions Survey, Norway was found to have the second-lowest average weekly work time (39.4 vs 43.2 h in the UK, 41.9 h in EU), and the lowest percentage of employees with a work-week exceeding 48 h (6% vs 13% in the UK, 15% in the EU).35 ,47
Even if the majority of Norwegian hospital doctors are satisfied with the present situation in terms of postgraduate training, significantly more senior doctors and those doctors working in the surgical domain would like longer work hours. The fact that senior doctors were more inclined than junior doctors to express the view that a longer working week would benefit junior doctors might suggest a ‘generational shift’.29 According to differences between doctors in different specialties, previous studies show that surgeons compared with non-surgeons have higher workload, longer working hours, more nights on-call and stronger professional interest.6 ,11 ,25 ,48 A recent study on Norwegian doctors in specialisation with data from 1999 to 2010 found the highest number of working hours per week in surgery, orthopaedics, anaesthesiology and internal medicine.25 According to a literature review on the impact of the working time regulations on medical education and training in European studies, doctors in the surgical domain perceive the work-week limitation largely negative on surgical training.29 Important elements in surgical training are based on being present and available in emergency situations, which cannot always be planned. It is also often a question of having taken part in a number of defined but not necessarily frequent procedures. If the training comes to a point where junior doctors too often miss important acute or emergency operations simply because they are not present, the only remedy is more presence. In a study among surgical residents and surgical consultants in Switzerland, 60% of surgical consultants felt that surgical residents should be present longer than the work-week limitation.17 Therefore, it should be considered whether Norwegian junior doctors in surgical training should practice longer hours, at least for parts of their training.
Strengths and limitations
The study's main strength is the representative cohort with repeated data that allows for generalisation to the whole population of hospital doctors in Norway. The response rates are fairly good, ranging from 67% to 95%, which are higher than in a number of similar studies,6 ,18 ,20–23 but do not rule out the possibility of non-response bias. Self-reported working hours may, of course, deviate from the actual number of hours worked, but it is not easy to judge whether the respondents are likely to overestimate or underestimate their own hours. The expanded specification of different elements of weekly work hours—secondary positions mentioned explicitly from 2006 and on-call time and professional update from 2008—should not affect the total number of hours worked since the questions have consistently focused on eliciting the total number of hours worked per week. The inclusions and exclusions of respondents over time, and the exchange between junior and senior doctors, is a reason for caution. Over a period of 18 years some doctors will also work in functions other than those of hospital doctors. Some doctors may leave the panel due to retirement, death or voluntary withdrawal, and a few senior doctors may become junior doctors if they embark on subspecialisation or want a second specialty.
Conclusion
The average weekly working hours and the proportion with suboptimal work–home balance did not change significantly among Norwegian junior and senior doctors from 1994 to 2012. No differences were found in weekly working hours of employed hospital doctors and self-employed GPs or private practice specialists. Junior and senior hospital doctors in Norway enjoy a shorter work-week than hospital doctors in several other countries. National working time regulations based on deliberations, cultural values and the high and growing doctor density are important causes. When the majority of Norwegian junior and senior hospital doctors report that sufficient postgraduate training schemes can be executed within a 45 h working week, it lends support to the EWTD of maximum 48 h. However, the specialty differences may call for more flexibility in working time regulations, particularly among surgeons.
Acknowledgments
The authors wish to thank all doctors who have supported this study by participating in the survey.
References
Footnotes
-
Contributors JR undertook the literature review and wrote the first draft. OGA made critical revisions. Both authors had full access to all of the data (including statistical reports and tables), designed the study and performed the statistical analysis.
-
Funding This research received no specific grant from any funding agency in the public, commercial or not-for-profit sectors.
-
Competing interests None.
-
Ethics approval According to the Regional Committee for Medical Research Ethics, the study based on “Norwegian Physician Survey—A bi-annual prospective questionnaire survey to a representative sample of Norwegian physicians” is exempt from review in Norway, cf. §§ 4 of The Act. The project can be implemented without the approval by the Regional Committee for Medical Research Ethics (IRB 0000 1870). Additionally, approval for data protection of the bi-annual prospective survey among Norwegian doctors was obtained from the Norwegian Social Science Data Service (Reference 19521).
-
Provenance and peer review Not commissioned; externally peer reviewed.
-
Data sharing statement The authors may be able to provide aggregated data on which the analysis is based, on request. No additional data available.