Article Text

Abstract
Objectives Visual impairment and blindness (VI&B) cause a considerable and increasing economic burden in all high-income countries due to population ageing. Thus, we conducted a review of the literature to better understand all relevant costs associated with VI&B and to develop a multiperspective overview.
Design Systematic review: Two independent reviewers searched the relevant literature and assessed the studies for inclusion and exclusion criteria as well as quality.
Eligibility criteria for included studies Interventional, non-interventional and cost of illness studies, conducted prior to May 2012, investigating direct and indirect costs as well as intangible effects related to visual impairment and blindness were included.
Methods We followed the Preferred Reporting Items for Systematic Reviews and Meta-Analyses statement approach to identify the relevant studies. A meta-analysis was not performed due to the variability of the reported cost categories and varying definition of visual impairment.
Results A total of 22 studies were included. Hospitalisation and use of medical services around diagnosis and treatment at the onset of VI&B were the largest contributor to direct medical costs. The mean annual expenses per patient were found to be US$ purchasing power parities (PPP) 12 175–14 029 for moderate visual impairment, US$ PPP 13 154–16 321 for severe visual impairment and US$ PPP 14 882–24 180 for blindness, almost twofold the costs for non-blind patients. Informal care was the major contributor to other direct costs, with the time spent by caregivers increasing from 5.8 h/week (or US$ PPP 263) for persons with vision >20/32 up to 94.1 h/week (or US$ PPP 55 062) for persons with vision ≤20/250. VI&B caused considerable indirect costs due to productivity losses, premature mortality and dead-weight losses.
Conclusions VI&B cause a considerable economic burden for affected persons, their caregivers and society at large, which increases with the degree of visual impairment. This review provides insight into the distribution of costs and the economic impact of VI&B.
- Visual Impairment
- Blindness
- Cost of Illness
- Health Economics
This is an Open Access article distributed in accordance with the Creative Commons Attribution Non Commercial (CC BY-NC 3.0) license, which permits others to distribute, remix, adapt, build upon this work non-commercially, and license their derivative works on different terms, provided the original work is properly cited and the use is non-commercial. See: http://creativecommons.org/licenses/by-nc/3.0/
Statistics from Altmetric.com
Strengths and limitations of this study
-
This is the first international and multiperspective overview of costs and intangible effects associated with visual impairment and blindness.
-
The review is able to demonstrate a considerable impact of visual impairment and blindness.
-
The study synthesis of the reviewed literature was limited as no two studies used the same methodology, reported exactly the same outcomes or used the same sample population. Therefore a meta-analysis could not be conducted.
Introduction
Visual impairment and blindness are foremost a problem of older age in all high-income countries and constantly increasing due to the ageing of populations.1 Globally, the burden of disease related to vision disorders has increased by 47% from 12 858 000 disability adjusted life years (DALYs) in 1990 to 18 837 000 DALYs in 2010.2 In high-income countries, health-related quality of life in severely visually impaired persons has been shown to be similar or even lower and emotional distress higher compared with other serious chronic health conditions such as stroke or metastasised solid tumours.3 Blindness and visual impairment impact not only the individual but also the family, caregivers and the community, leading to a significant cost burden. In Australia, the overall cost placed visual disorders seventh among diseases, ahead of coronary heart disease, diabetes, depression and stroke in terms of economic burden on the health system.4
As demands on healthcare continue to increase in all high-income countries, economic evaluations of disease, impairment and interventions have also become increasingly important.5 This necessitates a clear understanding of all aspects of the direct and indirect costs and intangible effects related to blindness and severe visual impairment, as almost all interventions in this area are aiming to prevent these and are often measured as an incremental cost effectiveness ratio (ICER), that is, the difference in cost compared to the difference in effectiveness. Similarly, faced with the increasing demand and limited resources in healthcare, these resources need to be prioritised, which again calls for a clear understanding of the economic impact of a disease or disorder. Against this background, we conducted a systematic review of the literature, collating all data available on the economic impact of VI&B.
Methods
The systematic review was conducted as suggested in the Preferred Reporting Items for Systematic Reviews and Meta-Analyses (PRISMA) statement which aims to improve the quality of systematic reviews by providing guidance and a 27-item checklist to aid in structuring methods and improving the reporting of results. It focuses on randomised trials, but can also be used as a basis for reporting systematic reviews of other types of research, for example, health economic evaluation studies. However, the checklist should not be used as a quality assessment instrument to measure the quality of included studies or the performed systematic review.6 The completed PRISMA checklist for this review can be found in online supplementary appendix 3.
Literature search
All economical and medical databases were searched from May to June 2012 through PubMed and OVID using the following terms
“low vision”, “visual impairment”, “visually impaired”, “blindness”, “blind”, “visual loss”, “costs”, “costs of illness”.
Subsequently, a second search was conducted using the main causes of visual impairment and blindness. Search terms were: ‘low vision’, ‘visual impairment’, ‘visually impaired’, ‘blindness’, ‘blind’, ‘visual loss’, ‘costs’ combined with ‘age-related macular degeneration’, ‘glaucoma’, ‘diabetic retinopathy’, ‘cataract’, ‘corneal opacities’, ‘childhood blindness’ separated by ‘or’.
Supplemental sources including references contained in identified articles were used in addition.
Two independent researchers screened identified articles using the following inclusion or exclusion criteria:
Inclusion
-
Data for direct and indirect costs related to VI&B. Cost-of-illness—or in this case cost-of-impairment—studies can be divided into disease-specific and general studies. Both types of studies were included if they contained relevant data.
-
Studies with outcomes related to intangible effects due to visual impairment and blindness.
-
Overall data for burden of illness related to affected persons and carers.
Exclusion
-
Costs pertaining to underlying diseases only with no specification of visual impairment levels.
-
Economic studies conducted in developing countries.
As we were interested in the burden of VI&B in high-income countries only, we excluded economic studies conducted in developing countries. Health services provision and treatment options differ vastly between high-income and middle-income or low-income countries, making a comparison of cost categories unfeasible.
Cost classification
All included articles were assessed as to which cost aspects they reported. Broadly, costs were divided into direct costs, indirect costs and intangible effects.7
Direct costs are defined as the actual expenses related to an illness and contain medical costs, non-medical costs and other direct costs.5 Medical costs measure the cost of resources used for treating a particular illness. Non-medical costs are costs caused by the disease but not attributed to medical treatment. In case of VI&B, these are supporting services, assistive devices, home care, residential care or transportation (travel expenses). Other direct costs comprise informal care, time spent in treatment by patients or caregivers or time spent in rehabilitation, training, self-help groups or preventative activities.5
Indirect costs are defined as the value of lost output caused by reduced productivity due to illness or disability.8Patients and caregivers are affected by indirect costs due to allowances (financial support for income, residence, benefits), productivity losses (absenteeism, salary losses, part-time employment, loss of work) and dead-weight losses as well as years of life lost. Dead-weight loss, also known as an excess burden, is not a clearly defined concept. In a purely economic sense, dead-weight loss describes the costs to society created by market inefficiency. In the context of our study, we refer to it as an excess financial burden on society caused by VI&B.
Intangible costs or effects refer to the burden of illness of affected persons and caregivers, and comprise, among others, loss of well-being or loss of quality of life. It can be captured using questionnaires and expressed in DALYs. As this aspect of costs is difficult to quantify, DALYs or other measures of intangible effects are rarely assigned a monetary value.
Commonly, cost categories considered in a particular study depend on the perspective the study is conducted from, that is, a healthcare payer's (direct medical and non-medical costs only) or patient's perspective, or a societal perspective (all costs).
As cost categories varied considerably between all cost-of-illness studies, all different direct and indirect cost categories were listed in online supplementary appendix 2 prior to being categorised into our broader categories as outlined above.
Quality of included studies
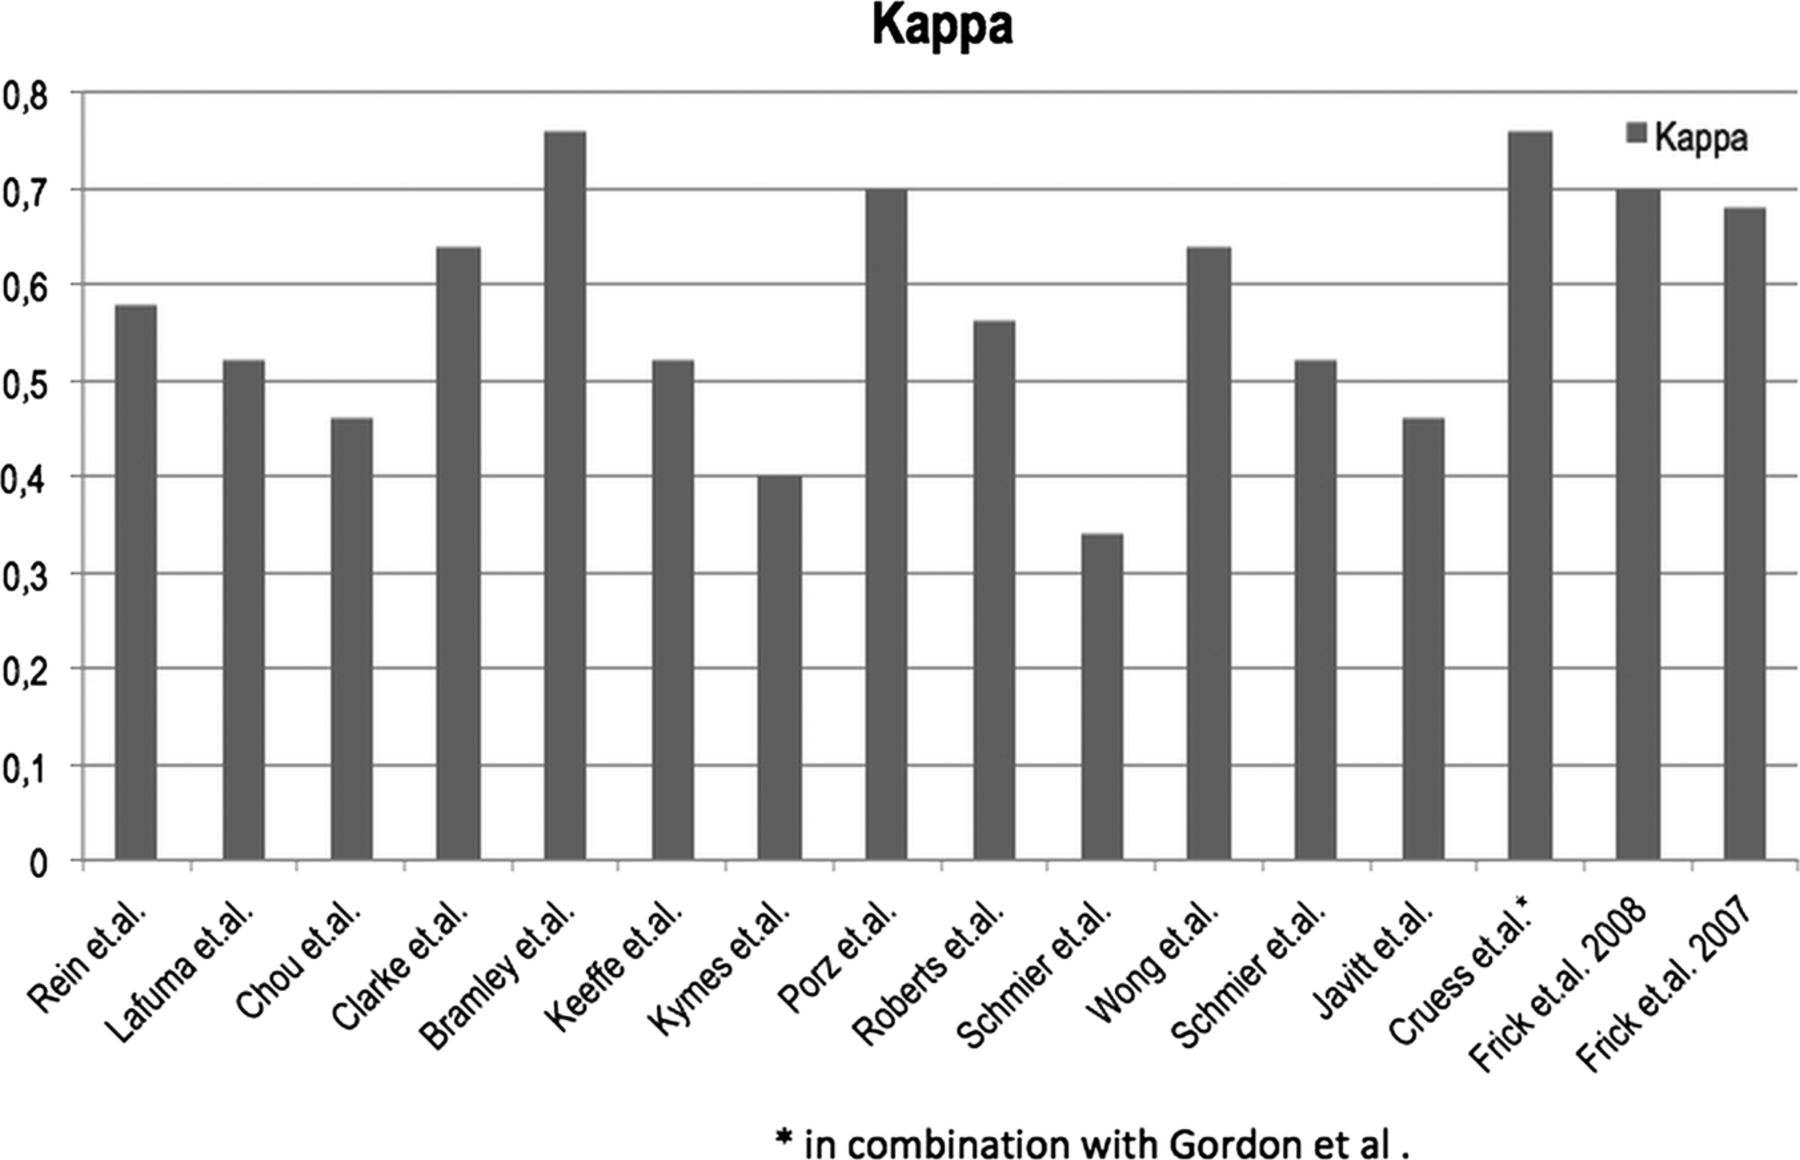
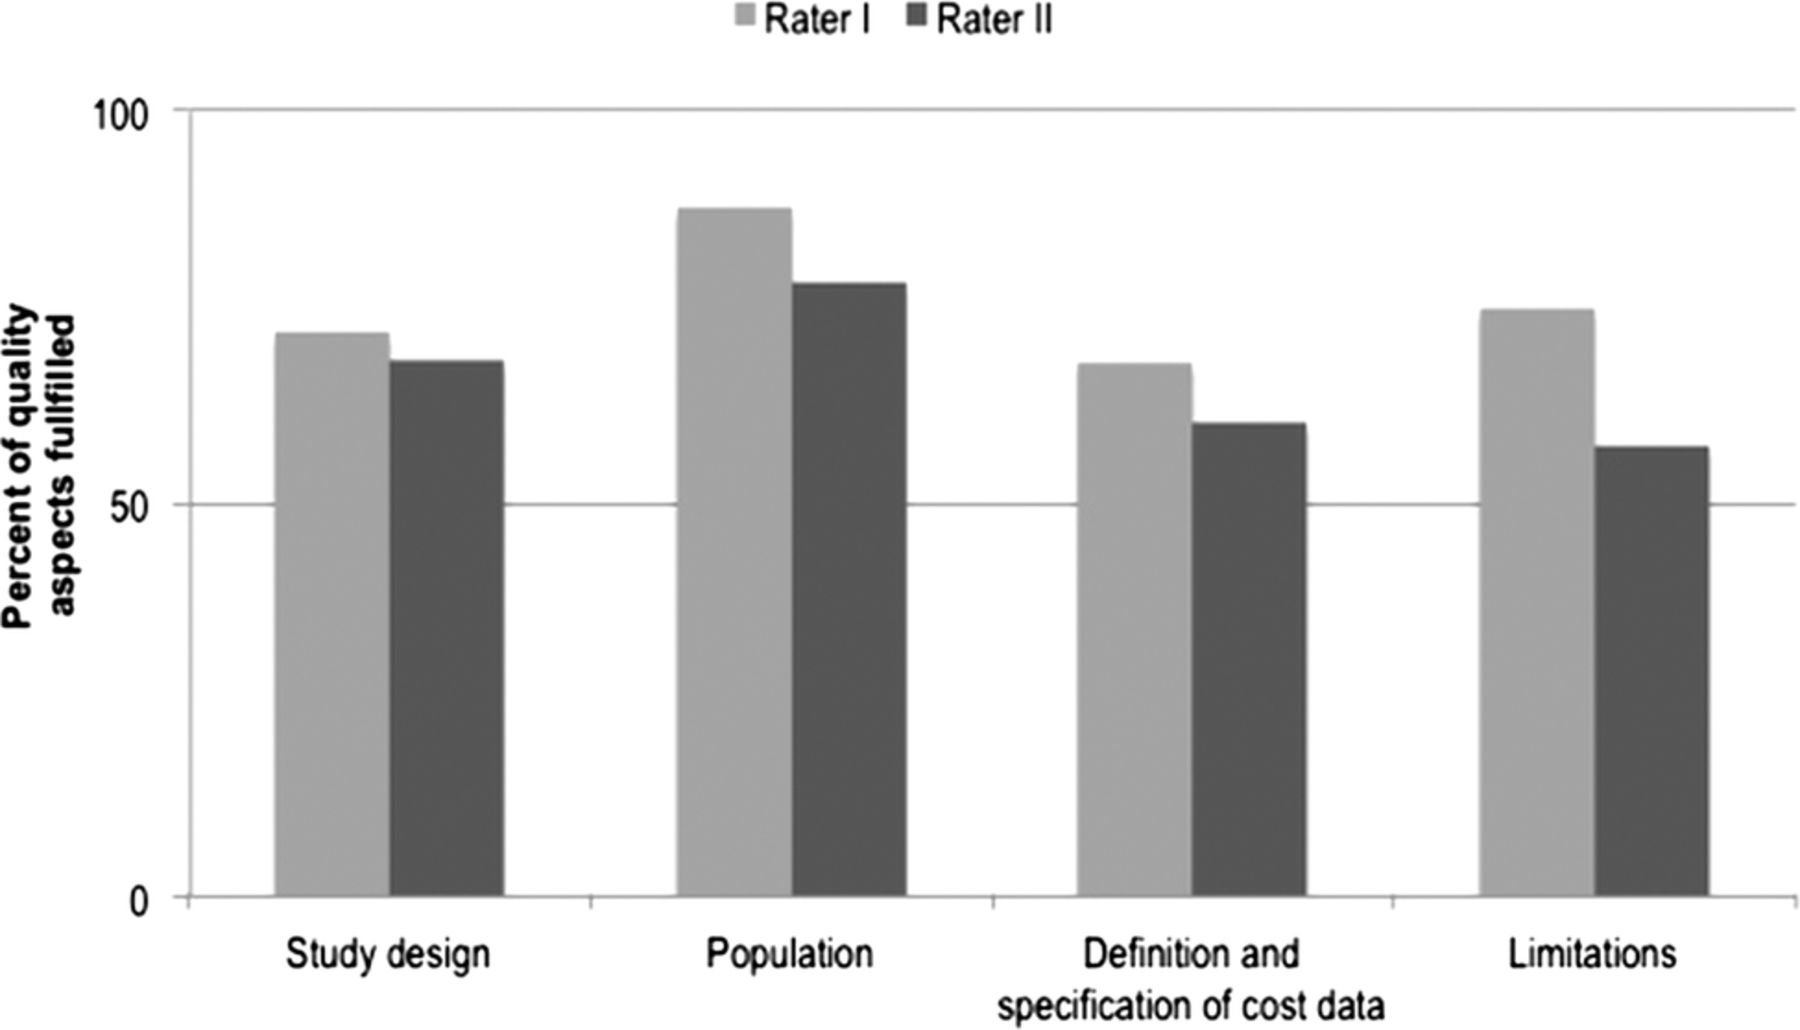
A checklist, based on the assessment tool of Emmert et al9 and extended by several questions covering relevant cost-of-illness aspects (see online supplementary appendix 1), was generated to assess the overall quality of included studies reporting direct or indirect costs of illness. The checklist contained sections on the study design, population, definition and specification of cost data and their limitations, including a total of 25 questions. Studies were rated from 0 to 100 for each of these categories. Two independent reviewers conducted the assessment and the interrater-reliability was assessed using κ (κn) as suggested by Brennan and Prediger10 for every study. The interpretation of the agreement was based on the agreement scale by Landis and Koch,11 which indicates fair agreement at κ levels between 0.21 and 0.40, moderate agreement between 0.41 and 0.60, substantial agreement between 0.61 and 0.80 and almost perfect agreement between 0.81 and above.
Conversion of cost-of-illness study results
For better comparison of costs across studies, the data were transformed: (1) costs were inflated to 2011 using a country-specific gross domestic product deflator, which takes fluctuating exchange rates, different purchasing power of currencies and the rate of inflation into account12 ,13 and (2) converted to USD using purchasing power parities (PPP).14 PPPs account for differences in price levels between countries, and convert local currencies into international dollars by taking the purchasing power of different national currencies into account and eliminating differences in price levels between countries. The transformed values are presented in million units (million US$ PPP) for total expenditures reported and in US$ PPP for costs per person.
Results
The search yielded a total of 390 articles. After applying all inclusion and exclusion criteria, 22 studies were included in the systematic review (figure 1). Altogether, there were nine studies conducted in the USA, six studies conducted in Australia, two studies from France and Canada and one study from each of the following countries: Germany, the UK, Japan. All included studies are summarised in table 1.
Characteristics of included studies

Flow chart of the literature search.
All 17 of 22 studies dealing with direct or indirect costs of illness were rated above 50 for all four main quality aspects, indicating a sufficient level of quality, and consequently were included in the review (see figure 2). The interrater-reliability was consistently high and only a few discrepancies had to be settled by a discussion between the two raters. κ scores ranged from 0.34 to 0.76 (figure 3).

Quality rating of included studies.
κ-Index per study.
Of all the included studies, 12 captured direct medical costs, 10 direct non-medical costs and six other direct costs. Six studies reported data on indirect costs and 10 studies on intangible effects. All cost components reported by studies within each cost category are summarised in online supplementary appendix 2, highlighting the considerable variability in obtaining and reporting cost aspects related to VI&B between all studies.
Direct medical costs
Direct medical costs occurred mostly due to hospitalisation, the use of medical services and medical products, and were reported either as incremental costs or, in some studies, provided as the length of hospital stay (table 2).
Results for direct medical costs
At the onset of VI&B, the two major contributors to direct medical costs are hospitalisations and costs due to the increased use of medical services around diagnosis and treatment.18 ,19 ,21 ,22 ,28 ,31 Costs related to the recurrent hospitalisations and ongoing but less frequent use of medical services remain major cost components in persons with VI&B in the long term. Costs related to drugs, however, did not emerge as a major direct cost factor.17 ,35 All identified costs correlated with the degree of visual impairment leading to the highest expenditures being associated with blindness. The considerable differences in study methods and reported outcomes makes a head-to-head comparison of results by study or country or aggregation of data in terms of meta-analyses for direct medical costs very difficult. Several studies based on representative samples of Medicare beneficiaries in the USA reported mean annual expenses per patient to be US$ PPP 12 175–14 029 for moderate visual impairment, US$ PPP 13 154–16 321 for severe visual impairment and US$ PPP 14 882–24 180 for blindness, which is almost a 100% excess of the estimated mean annual cost for non-blind patients at the upper end of the range (table 2).
Direct non-medical costs
Assistive devices and aids, home modifications, costs for healthcare services such as home-based nursing or nursing home placements were the major contributors to direct non-medical costs (table 3). With worsening visual acuity, direct non-medical costs for support services and assistive devices increased from US$ PPP 53.90 for a person with visual acuity ≥20/20 up to US$ PPP 608.71 for a person with visual acuity ≤20/80.32 Nursing home-placements and professional care costs incurred the highest expenditures followed by domestic modifications. These costs, however, were highest initially shortly after the loss of vision and in the majority were incurred only once (table 3).
Results for direct non-medical costs
Other direct costs
Six of the included studies reported costs caused by informal care. Time spent on caring for or assisting visually impaired persons was related to the degree of visual impairment, with blind persons requiring the most assistance. The time spent by caregivers ranged from 5.8 h/week for a person with a visual acuity of >20/32 and a cost of US$ PPP 263 up to 94.1 h/week and costs of US$ PPP 55 062 for persons with a visual acuity of ≤20/250.33 All studies differed slightly as to the nature of direct costs assessed. Some studies reported on governmental, out-of-pocket expenses as well as opportunity costs, whereas others considered only one or two of these. The wide range of time and resources spent on informal care provision demonstrates the broad economic impact and considerable burden of informal care provision with concurrent expenses at a personal and societal level. Again, the reported cost aspects and methodologies differ considerably with, for example, Keeffe et al24 reporting out-of-pocket expenses and Lafuma et al26 reporting time spent on caring using an hourly rate. The multitude of differing approaches in each study does not allow for a head-to-head comparison but gives a comprehensive impression of the complex cost situation and highlights the importance of providing assistance to VI&B (table 4).
Results for other direct costs
Indirect costs
Studies of indirect costs demonstrate high expenditures related to productivity losses, changes in employment (employer and/or area of work), loss of income, premature mortality and dead-weight losses (table 5). Received social allowances were detailed in one study but not counted towards the overall costs as they were considered as transfer costs.29 One study included the loss of caregivers’ time, which is spent not only on support in terms of productivity loss but also as a loss of personal time and time to engage in leisure activities.26 Equal to other cost components, indirect costs correlated with the degree of visual impairment, with the highest indirect costs reported for blind persons. Compared to all other cost categories, indirect costs due to productivity losses, lower employment rates and losses of income in patients as well as caregivers caused the highest economic burden. Annual estimates of productivity losses and absenteeism due to VI&B in the USA and Canada range from US$ PPP 4974 to 5724 million, and are estimated to be US$ PPP 7367 million for an overall decrease in workforce participation in the USA (table 5).
Results for indirect costs
Intangible effects
Most studies used personal burden such as depression, emotional distress, loss of independency, loss of quality of life, limitations in activities of daily living or hazards such as falls and injuries to capture intangible effects of VI&B. Two studies, set in Japan and Canada, reported a loss of well-being as DALYs and an associated cost of US$ PPP 51.8 billion and US$ PPP 15.11 billion/year, respectively.19 ,31 Every reviewed study reported a high burden caused by multiple individual restrictions in patients and also in caregivers, which was found to be increasing with the degree of visual impairment (table 6). Mortality associated with visual impairment was reported to increase linearly from 4.5% in persons with normal visual acuity (≥20/20) to 22.2% in blind persons (visual acuity of <20/200).27 Measured as a restriction in caregivers, Brezin et al16 reported an increase from 1.6% of caregivers of non-visually impaired persons, who reported restrictions in going out during the day, up to 12% for caregivers of blind patients.
Results for intangible effects
Discussion
In this first systematic review of costs associated with VI&B, we could demonstrate a considerable impact of VI&B in terms of the associated direct and indirect costs, as well as intangible effects such as loss of well-being, independence and excess mortality. The highest costs are caused by productivity losses in VI&B as well as their carers, followed by formal and informal caregiving, recurrent hospitalisations and the use of medical and supportive services in the VI&B. A much larger economic impact was due to intangible effects such as loss of independence, quality of life and excess morbidity. However, these are very difficult to quantify in monetary terms and only a small number of studies attempted this. All highlighted cost components as well as intangible effects which contribute to the overall economic impact of VI&B need to be considered in economic evaluations not only of VI&B but also of interventions aimed at averting these, depending on the focus of the economic evaluation.
A large proportion of the direct costs reported in reviewed studies are not directly related to eye-related medical care, but to falls and other accidents due to visual impairment, exacerbation of diabetes due to a reduced ability to self-manage, depression related to loss of vision and further excess morbidity.23 Drug costs were not a major contributor to overall costs, which is mirrored in studies investigating chronic diseases such as diabetes mellitus, where—despite its ongoing use—hypoglycaemic drugs constitute only a small proportion of overall direct medical costs.37 The annual mean costs of other potentially incapacitating chronic diseases such as diabetes mellitus (€5262 or US$6889)37 or the first year after a stroke (US$14 361)38 were much lower for diabetes and similar for the stroke estimate compared to the mean annual costs of severe VI&B.15 ,23 This is most likely due to the average diabetic not requiring professional caregiving of a scale required during the first year after a stroke or in severely VI&B. In severely VI&B, however, these costs are incurred every year following the loss of vision and do not decrease significantly over the following years unlike the reported annual costs for stroke.38 Javitt et al23 report all direct medical costs caused by visual impairment to amount to US$2.14 million in 2003 in all non-institutionalised Medicare beneficiaries 69 years and older, and postulate a much higher cost for the whole of the US population. With the introduction of anti-Vascular-Endothelial-Growth-Factor treatment for a number of potentially blinding eye diseases such as neovascular age-related macular degeneration, diabetic macular oedema or macular oedema in retinal vein occlusions since all reviewed studies were conducted, the overall direct medical costs associated with visual impairment can be expected to be much higher today. This increase in cost is exacerbated by the ageing of populations in all developed countries as all major blinding diseases are age-related.30
Our finding that indirect costs are much higher than direct costs caused by VI&B is mirrored by virtually all other cost-of-illness studies assessing the economic impact of diseases or impairments which result in absenteeism and reduced ability to work.39 ,40 Back pain, for example, was found to cause considerable absenteeism and disablement, which—despite its significant hospital cost—lead to indirect costs constituting 93% of the overall costs in 1991 in the Netherlands.40 Even in treatment and healthcare resource intensive chronic diseases such as diabetes mellitus, indirect costs pose more than half of the overall costs caused by the illness.39
All studies which assessed intangible effects in economic terms reported these to be the largest contributor to the overall economic impact of VI&B. Considering the adverse impact of losing vision on quality of life, independence and the ability to participate in society, this is not surprising. We and others have previously reported that even mild visual impairment (0.3<LogMAR<0.5) has a significant and independent impact on vision-specific functioning.41–43 Similarly, emotional well-being is affected in patients with even mild vision impairment.42 Depression is considered to result in further functional decline in this group by reducing motivation, initiative and resiliency.44–46 Even unilateral vision loss had a measurable impact on falling and some other activities of independent living, with increased odds of having problems in many activities of daily life in a study conducted by Vu et al.34 All this very adversely impacts the ability to participate in society, but also contributes to the considerable economic impact of intangible effects caused by VI&B.
There are several limitations which necessitate a careful interpretation of the overall findings. Using keywords to identify relevant literature always bears the potential of a too narrow focus, and not all the relevant literature may have been included. As we were interested in the economic burden of VI&B in high-income countries, we did not include (uncorrected) refractive error in our search terms as this is mostly a problem of middle-income and low-income countries, and excluded studies conducted in middle-income and low-income countries, which limits our results to high-income countries. Based on the searches conducted, as well as the cross-searching performed based on references, the authors are confident that the vast majority of the relevant literature could be included. To the authors’ knowledge, a standardised quality checklist has not been used to assess economic evaluations of the impact of VI&B prior to inclusion in a systematic review until now. This further increases the overall quality of our review. The study synthesis of the reviewed literature was limited as no two studies used the same methodology, lacking a standardised definition and specification of cost components (see online supplementary appendix 2). Furthermore, no two studies reported exactly the same outcomes or used the same sample population. These problems have been reported for cost-of-illness—or in this case cost-of-impairment—studies in other areas, and adherence to existing cost-of-illness study guidelines is recommended.12 ,13 ,47 Unfortunately, none of the reviewed studies seem to have adhered to any of the available international standards, and thus the overall comparability is limited. Similar to cost-of-illness studies in other areas, studies are summarised mostly descriptively or at a high level of aggregation.12 The same applies to the chosen categories of visual impairment used in all studies, which differ considerably and further limit our ability to collate results (table 1).The perspective (affected person, healthcare payer, societal) of the study was only described in a minority of studies, and as highlighted in the results section, most studies were conducted in the USA and Australia, making inferences to other countries and healthcare systems difficult. However, this is the only systematic review of the economic impact of VI&B until now, highlighting the very broad economic impact and outlining the considerable scope that a comprehensive economic evaluation in this area should ideally have.
In conclusion, VI&B cause a considerable economic burden for affected persons, their caregivers and society at large, which increases with the degree of visual impairment for all assessed cost categories as well as intangible effects. This review highlights a large amount of cost categories which should be considered in economic evaluations in eye health, and future cost-of-illness or cost-of-impairment studies should adhere to the available guidelines to improve comparability. The review highlights the considerable amount of resources spent on caring for VI&B persons in the absence of a cure.
References
Supplementary materials
Supplementary Data
This web only file has been produced by the BMJ Publishing Group from an electronic file supplied by the author(s) and has not been edited for content.
Files in this Data Supplement:
- Data supplement 1 - Online appendix
- Data supplement 2 - Online appendix
- Data supplement 3 - Online appendix
Footnotes
JK and KB contributed equally.
-
Contributors KB and CS searched the databases and extracted the references; KB, CS and JK collated the studies; KB, JK and RF drafted the manuscript. All authors contributed to the design of the review and critically revised the manuscript.
-
Funding The study was supported by the German Research Council (DFG FI 1540/5-5, grant to RPF), by an unconditional grant from Novartis Pharma Germany and by the Australian National Health and Medical Research Council Centre for Clinical Research Excellence #529923—Translational Clinical Research in Major Eye Diseases. CERA receives Operational Infrastructure Support from the Victorian Government. The funders had no role in the study design, data collection and analysis, decision to publish, or preparation of the manuscript.
-
Competing interests None.
-
Provenance and peer review Not commissioned; externally peer reviewed.
-
Data sharing statement No additional data are available.