Article Text

Abstract
Background: Tests of genotype may enable workers at unusual risk of future ill-health to be identified. Using them to select for employment, however, entails gains and losses to employers and employees. Ensuring a fair balance between the rights and obligations of each group requires a value judgement, but the advantages and disadvantages to interested parties must first be quantified in a meaningful way.
Method and Results: The purposes of pre-employment screening are reviewed, and several simple measures relevant to the separate interests of employers and job applicants proposed—number screened to prevent a single adverse outcome; number excluded to prevent a case; expected incidence of the adverse outcome in those excluded; and preventable fraction. The derivation of these measures is illustrated, and the factors that influence them (the prevalence of the prognostic trait, the relative risk that it carries for an adverse outcome, and the overall incidence of disease) are related algebraically and graphically, to aid judgement on the utility of screening under different circumstances.
Conclusions: In sensitive areas such as genetic testing the onus should be on the employer to justify plans for pre-placement screening. Several quantitative measures can be used to inform the ethical and economic debate about screening and to evaluate alternative strategies for prevention.
- genetic
- genome
- pre-employment
- screening
- NTE, number needed to exclude
- NTS, number needed to screen
- PF, preventable fraction
- RR, relative risk
Statistics from Altmetric.com
The recently completed mapping of the human genome has raised expectations that in future it will be possible to predict a person’s susceptibility to illness more reliably than at present.1 One potential application could be in the selection of workers for employment. In some European countries (for example, Austria, Denmark, France, Norway, and Sweden) the use of genetic testing for this purpose is limited by legislation or by codes of practice that mandate a direct link to safety in the job.2 In the UK there are no such restrictions and, while tests of genotype are not currently used to inform employment decisions, the availability of such tests could increase and the pressures to apply them grow. In the United States there has already been evidence of genetic discrimination in employment.3 Many chronic illnesses may prove to have to a detectable genetic component, encouraging the development of new screening tests. It is timely, therefore, to examine the criteria by which the merits of such testing should be evaluated.
The use of genetic testing in decisions on employment requires both economic and ethical justification. As with any form of health screening, the financial and other costs of implementation should be outweighed by the expected benefits. Moreover, because the gains and losses from pre-placement health screening are shared between several parties (employers, employees, and the general public), and generally not in equal measure, a fair balance must be struck between the rights and obligations of each group, as well as the impact on society and the public health.
In this context, knowledge of genotype is widely viewed as being more sensitive than many other categories of health information, and potentially more damaging to the individual concerned.4 On the one hand there are worries that it could compromise a person’s ability to obtain insurance, and on the other that knowledge of an increased risk of disease might cause individuals and their blood relatives needless distress. Potentially it conveys health implications for families as well as those screened. Genetic knowledge is also personal, intimate, and confidential. There is a widely held view that individuals should be able to exercise prime control over its disclosure. In the UK, the Human Genetics Advisory Commission (HGAC) proposed, as a matter of principle, that people should not be required to take a genetic test for employment purposes, or be required to disclose the results of a previous test, unless it is definitely needed to assess susceptibility to harm or current ability to perform a particular job safely.5 Similar recommendations have been framed by the Nuffield Council on Bioethics,6 the House of Commons Science and Technology Committee,7 and a steering group of the British Medical Association.8 The Council of Europe’s Convention on Human Rights and Biomedicine9 also discourages indiscriminate predictive testing for genetic disease in employment. However, the HGAC suggested that employers should offer a genetic test (where available) if “it is known that a specific working environment or practice, while meeting health and safety requirements, might pose specific risks to individuals with particular genetic constitutions” and that “for certain jobs where issues of public safety arise, an employer should be able to refuse to employ a person who will not undertake a relevant genetic test”.5 A later report by the Human Genetics Commission (the body that succeeded the HGAC), recommended careful consideration of this principle on a case by case basis.10
Ultimately, decisions on the economic and ethical acceptability of pre-placement health screening hinge on value judgements. However, before such judgements can be exercised, the advantages and disadvantages to the various interested parties must be quantified in as meaningful a way as possible.11 Those who stand to gain or lose from a screening programme will vary according to the purpose for which it is carried out.
THE USES OF PRE-PLACEMENT HEALTH SCREENING
Pre-placement health screening is carried out for several purposes. One aim may be to identify individuals who would be unusually susceptible to a hazard in the workplace. For example, it is known that certain polymorphisms influence immune response12 and capacity to detoxify or repair the damage caused by xenobiotic agents.13 Consideration has been given to the possibility of screening for α1 antitrypsin deficiency in workers at risk of chronic lung disease,14 for polymorphisms of the human leucocyte antigen in those exposed to beryllium,12,15 and for glutathione S-transferase M1 null genotype as a risk modifier for solvent induced toxic encephalopathy.16 Knowledge of personal vulnerability in such situations may assist in the counselling of workers and in decisions about job placement, although it should not detract from the control of hazardous exposures at source.17,18 Where practical, controls on exposure should be sufficient to protect all workers, whatever their genetic constitution and health status.
Main messages
-
The advantages and disadvantages of genetic screening need to be quantified from the viewpoint of both employers and job applicants.
-
Simple measures relevant to these separate interests include the number screened to prevent a case of disease, the number excluded to prevent a case, the expected incidence of the disease in those excluded, and the preventable fraction.
-
These factors can be estimated if the prevalence of the prognostic trait, the relative risk it carries, and the overall incidence of the disease are known
Another objective of pre-placement health assessment may be to select out workers whose health would prevent them from carrying out a job as safely as other employees, thereby endangering themselves, their colleagues, or the public more widely. This is the basis, for example, on which pilots are screened for coronary heart disease.19
A third reason for health screening before placement may be to identify workers who, because of a health problem, are unlikely to be capable of carrying out satisfactorily the job for which they are being considered. For example, a person with early motor neuron disease might be judged unsuitable for appointment to a training post if the employer’s investment in their training would not be returned until they had worked for at least five years.
Table 1 summarises some potential advantages and disadvantages to different parties in each of these three scenarios.
Some potential advantages and disadvantages of pre-employment screening from different viewpoints
QUANTIFYING THE GAINS AND LOSSES FROM PRE-PLACEMENT SCREENING
A genetic test is often assessed as accurate if it correctly identifies the underlying genotype. Incomplete expression of the genotype is a well recognised problem (not everyone with a positive test may go on to suffer the disease) and so the usefulness of a test may be judged by the extent to which the genotype finds expression in the phenotype. However, in pre-placement screening it is more relevant to know how well a test predicts incident disease. Conventionally, the validity and potential utility of clinical investigations are assessed in terms of their sensitivity, specificity and predictive value for such outcomes of interest. In addition, when weighing up the gains and losses, other measures may be useful, particularly ones that are relevant to the separate interests of employers and job applicants.
Number screened to prevent a case
One such measure is the number of potential appointees that must be screened on average to prevent a single case of the adverse outcome (number needed to screen, NTS). This is analogous to the “number needed to treat” that is sometimes derived in the evaluation of a therapy, and it is relevant principally to employers.
Policy implications
-
Value judgement is still required, but the measures described can help to gauge the circumstances in which genetic testing might be helpful, and those in which it would probably be unacceptable or ineffective.
-
The preventable fraction also allows comparison with alternative strategies for prevention.
Number excluded to prevent a case
As well as the cost of the screening test, the employer must also bear the expense of recruiting replacements for job applicants who are excluded at screening. To assess this additional cost, a second index, the number needed to exclude (NTE) can be calculated. This is defined as the number of potential appointees that must be excluded on average to prevent one case of the adverse outcome.
Expected incidence in excluded workers
Although attendance for health screening can be an inconvenience to job applicants, the costs of the exercise fall mainly on employers. The major drawback of screening for employees is that they may be unnecessarily excluded from a job that they want. Against this, they may benefit from a screening programme if it prevents them from being injured by a hazard to which they are susceptible, or from investing time and personal resources in training for an unsuitable career. To summarise the advantages and disadvantages of pre-placement screening from the viewpoint of employees, a more relevant measure is the expected incidence of the adverse outcome in those excluded (Iexc). Iexc matters less to an employer who pays for the costly treatment or compensation of avoidable disease, as screening may carry a cost-benefit to him, even for rare outcomes.
Preventable fraction
A further index of performance is the proportion of adverse outcomes that can be prevented by the screening programme (preventable fraction, PF). This is useful when comparing the potential impact of screening with that of other strategies for the control of hazards in the workplace.
AN EXAMPLE: ATOPY AND SENSITISATION IN BAKERS
Use of tests that characterise the genotype is limited at present, but the principles that inform quantitative assessment are essentially the same as those which underlie decision making on the basis of phenotype, profile of exposure, medical history, or other well measured personal risk factors. Similar considerations would apply, for example, as in evaluating a policy of screening for atopy to prevent sensitisation in subjects exposed to occupational allergens, or smoking to prevent occupational asthma in workers who work with platinum salts, or obesity to prevent back pain in subjects who lift at work. Thus, the derivation of these measures can be illustrated using data from a study by Nieuwenhuijsen and colleagues20 on risk factors for sensitisation to α-amylase in bakers.
In this investigation, 241 workers with no prior occupational exposure to flour who were employed in a bakery or flour mill between 1986 and 1990 were tested in 1990 for atopy (defined as one or more positive skin prick tests to grass pollen, cat fur, and house dust mite) and for sensitisation to fungal α-amylase (a positive skin prick test to a prepared extract of wheat flours containing the enzyme). Altogether, 86 (36%) subjects tested positive for atopy and 12 (5%) for sensitisation to fungal α-amylase. Subjects were also categorised according to the level of their exposure to the fungal enzyme—estimated from hygiene measurements in a stratified random sample of employees representing the different tasks and work departments. In an analysis which adjusted for both factors, the relative risk (RR) of sensitisation was raised nearly threefold in subjects who tested positive for atopy and tenfold in the highest compared with the lowest category of exposure (table 2).
Relative risk of sensitisation to amylase in 241 bakery and flour mill workers according to atopic status and exposure categories (after Nieuwenhuijsen and colleagues20)
On the basis of these data, what gains and losses might accrue from a policy that entailed screening for the atopic trait before employment and excluding those who tested positive? And how do the potential gains compare with those that could be achieved by adequately controlling the highest levels of exposure?
To address these questions, we make some simplifying assumptions—namely that:
-
The assessment of atopy gave the same results as would have been obtained had the testing been carried out before employment commenced.
-
The findings fairly reflect the risks associated with atopy and exposure to “flour dust” in flour mills and the baking industry, as measured by the techniques described; accurately measure the outcome; and are unaffected by survivor bias and losses to follow up. (A dynamic rather than a fixed cohort was studied, and precise data are not provided on dates of employment, but the measured prevalence of sensitisation in 1990 is assumed to approximate to the cumulative incidence, had follow up been complete.)
-
The measured health end-point (sensitisation to α-amylase) is important enough to justify exclusion from employment (an arguable contention).
The next step is to construct a 2×2 table relating the frequencies of atopy and of sensitisation to α-amylase (table 3). The marginal totals are taken directly from the published report of the study. If R is the absolute risk of sensitisation in subjects without atopy, then the risk among atopics, taking the published relative risk, will be 2.9×R. Thus, the expected number of atopics sensitised to α-amylase is 86×2.9×R, while among non-atopics the expected number is 155×R. However, we know that the total number expected is 12. It follows that 86×2.9×R+155R = 12. This equation can be solved for R, allowing calculation of the top right hand cell of the table ( = 155×R). The other cells follow by subtraction from the marginal totals.
Expected count of subjects classified according to atopy and sensitisation to amylase (after Nieuwenhuijsen and colleagues20)
Suppose that a workforce comprises 155 employees. Table 3 indicates that to recruit this number of workers, an employer would have to screen 241 applicants, of whom 86 would be excluded because they were atopic. Among the 155 who were appointed, 4.6 would subsequently become sensitised to fungal α-amylase. However, in the absence of screening, the number of sensitised cases would have been 155×12/241 = 7.7. The screening programme would therefore prevent 3.1 cases among the 155 employees.
It follows that the NTS is 77 (241/3.1), the NTE is 28 (86/3.1), and the PF is 0.4 (3.1/7.7) or 40%. Among the 86 excluded applicants, 7.4 would become sensitised, so the expected incidence in excluded workers (Iexc) is 0.086 (7.4/86) or 8.6%.
Calculation of the PF enables a comparison of the proportion of cases that would be prevented if, instead of the screening programme, occupational hygiene was improved so that the 17 workers in the high exposure category were only exposed to the medium category level. Given the relative risks in table 2, the fraction of cases eliminated by this approach would be 17×(9.9–3.9)/(203+21×3.9+17×9.9) = 0.22, or 22%.
FACTORS THAT INFLUENCE THE COSTS AND BENEFITS OF SCREENING
The PF, NTS, NTE, and Iexc for a screening programme will depend on the prevalence of the prognostic indicator and the relative risk (RR) that it carries for the adverse outcome that is to be prevented. The relationships are summarised algebraically in the box and illustrated in figures 1 to 4 (for an assumed cumulative incidence of disease of 10%).

Preventable fraction (PF) and its relation to the prevalence and relative risk (RR) of a prognostic indicator.
The prevalence of a prognostic indicator has a large bearing on the PF, NTS, and NTE. For indicators that are rare (1% or fewer of those screened) the PF will be low, even when its presence carries a high RR (fig 1). Thus, for a prognostic indicator with a prevalence of 1%, the PF is less than 5%, even for a RR of 5. On the other hand, for an indicator with a prevalence of 20% and a RR of 5, the PF approaches 45%.
A low prevalence of prognostic indicator (1% or less) also means a high NTS (⩾100), since the proportion of cases prevented cannot exceed, and will normally be substantially less than, the proportion of subjects who are positive on the test. Figure 2 shows, for example, that if the prognostic indicator has a 1% prevalence and the RR is 3, then the NTS exceeds 500. Conversely, for a given overall cumulative incidence of the disease of concern (Iall) and RR, NTE tends to decrease for lower prevalences of the prognostic indicator (fig 3).
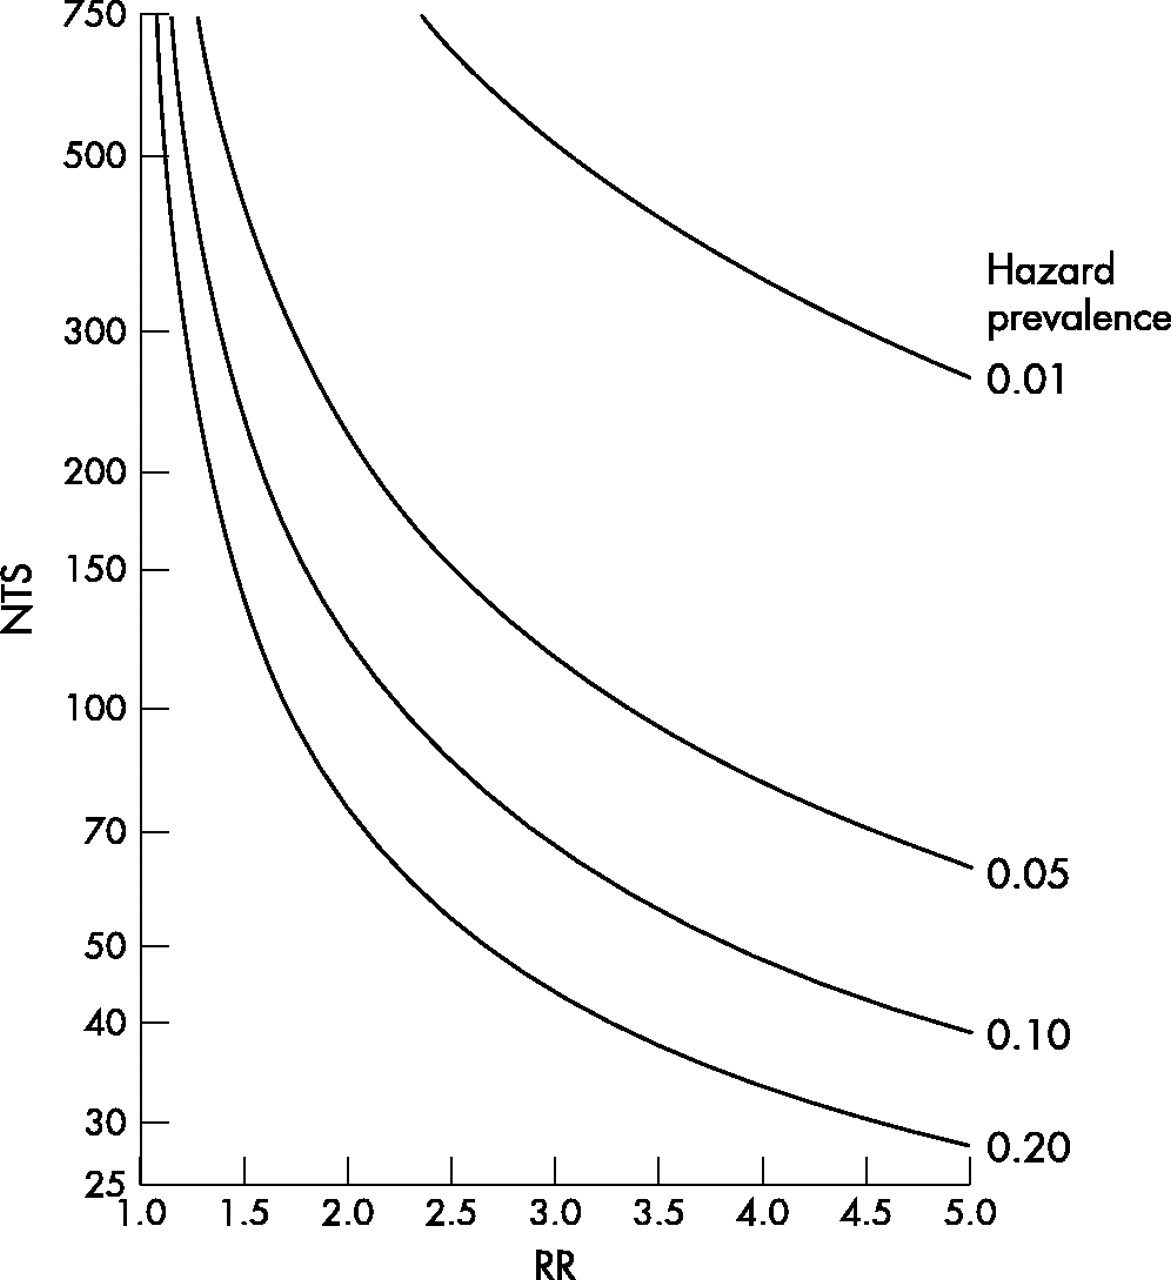
Number needed to screen to prevent a case (NTS) and its relation to the prevalence and relative risk (RR) of a prognostic indicator.

Number needed to exclude to prevent a case (NTE) and its relation to the prevalence and relative risk (RR) of a prognostic indicator.
Also, as indicated by the formulae in the box, all of the measures except PF are influenced by the overall incidence of disease. NTS and NTE are inversely proportional, and Iexc is directly proportional to Iall. Thus, if Iall were 1% rather than the 10% assumed in fig 2 to 4 then the NTS and NTE would be 10 times higher than presented, while Iexc would be 10 times lower. Iexc tends to increase with RR, as would be expected, but its relation to the prevalence of prognostic indicator in fig 4 (a lower prevalence is associated with a higher Iexc) should not be taken to imply that it is causally influenced by the prevalence of the indicator. This is apparent in the graph only because Iall is constrained to remain constant. (A reduction in the prevalence of prognostic indicator would normally lead to a reduction in Iall.)

Expected incidence of disease in those who test positive for a prognostic indicator (Iexc) and its relation to the prevalence and relative risk (RR) of the indicator.
EXTENSIONS TO THE MODEL
These calculations take no account of the importance, severity, or longevity of the health outcome (in general, the more serious or long lived it is, the greater would be the acceptable cost of screening); furthermore the economic cost of screening, financial savings to the employer, and financial penalty to the employee are only represented indirectly. We have also restricted our focus to the impact on labour health, whereas at the societal level there may be other costs and benefits to be weighed (such as improved longevity, altered health demand, and the long term psychological consequences of screening). The model could, however, be extended with more information. For example, if RR were known for a given loss of quality adjusted life years, or for a given numbers of days of sick leave incurred during illness, or for the treatment costs of a given illness episode, and the screening costs were known, then a more sophisticated analysis would be possible.15,21 The statistical uncertainty surrounding point estimates of risk can also be accommodated, simply by repeating the calculation for a different set of input assumptions, such as those that would arise from RRs lying at the 95% confidence limits.
Algebraic summary of relationships
-
The four measures of interest, NTS, NTE, PF, and Iexec, can be calculated directly.
-
If:
-
Relative risk = RR
-
Prevalence of the prognostic indicator = P
-
Overall cumulative incidence of the disease of concern = Iall
-
-
Then:


CONCLUSION
A number of indices have been described to aid in the evaluation of pre-placement health screening. Although they have a wide application, these indices may be particularly relevant when genetic testing becomes an issue and economic and ethical justification take a more prominent role. Several of the measures are relevant to the ethics of proposed screening programmes: How many workers must be excluded from a job to prevent a single case of the adverse outcome? What are the expected benefits, if any, for the workers who are excluded? How effective would the screening be in comparison with other possible preventive strategies? By combining the indices that we have described with financial data (for example, the cost of a screening test, the cost of replacing a job applicant who is excluded), it is possible to assess the economics of pre-placement health screening.
The scope for evaluating screening programmes in this way depends on the availability of appropriate (unbiased and generalisable) data on the prevalence of prognostic indicators and the relative and absolute risks with which they are associated. However, particularly in sensitive areas such as genetic testing, the onus should be on the employer to justify the use of screening before it is instituted. Where relevant data are not available, preliminary calculations of the type presented in the tables may help to determine whether research to obtain the missing information would be worthwhile.
Acknowledgments
We are grateful to the Human Genetics Commission’s Secretariat for advice on HCG publications and policy. KTP and RGR are members of the Health and Safety Commission Occupational Health Advisory Committee’s Genetics Working Group. However, the views expressed in this paper are their own and do not necessarily reflect the views or policy of the HSE and HSC.